Lesson 02
Spatial relationships and operations
based on scipy2018-geospatial
goals of the tutorial
- load tabular data files (eg. csv or xls) as geodataframe
- spatial projection conversion
- spatial relationships
- spatial joins
- spatial operations
based on the open data of:
- ISTAT Italian National Institute of Statistic
- Italian Ministry of Agricultural, Food and Forestry Policies
requirements
- python knowledge
- pandas
- previous lesson
status
“Spatial is Special”
SETUP
for the spatial operations we need to improve geopandas with some libraries.
You can use rtree o pygeos
rtree
if you want use rtree you need also to install a C library in your O.S.
Pyton RTree is a wrapper to the library libspatialiteindex
if you are using a Linux distribution based on Debian (like the instance of Google Colab) you have to install the libspatialindex library before
import platform

try:
  import rtree
except ModuleNotFoundError as e:
  if (platform.system() == 'Linux'):
    !apt-get install libspatialindex-dev
    !pip install rtree==1.0.0
    import rtree

if rtree.__version__ != "1.0.0":
  !pip install -U rtree==1.0.0
  import rtree
pygeos
PyGEOS is a Python library for working with GEOS geometries. It is a wrapper for the GEOS C API.
try:
  import pygeos
except ModuleNotFoundError as e:
  !pip install pygeos==0.13
  import pygeos
geopandas
version 0.10.1
try:
  import geopandas as gpd
except ModuleNotFoundError as e:
  !pip install geopandas==0.10.1
  import geopandas as gpd
  if gpd.__version__ != "0.10.1":
    !pip install -U geopandas==0.10.1
import pandas as pd
import requests
import matplotlib.pyplot as plt #to avoid the warning message by plotting the geometries
import warnings
warnings.simplefilter("ignore")
data setup
administrative units of italy
geopackage with the administrative units of italy
The couse offers the file in a geopackage stored here
url = 'https://github.com/napo/geospatial_course_unitn/raw/master/data/istat/istat_administrative_units_2022.gpkg'
macroregions = gpd.read_file(url,layer="macroregions")
WARNING:fiona._env:File /vsimem/d0bc5a89a3d64c6f8d22980a72124fb4 has GPKG application_id, but non conformant file extension
you can repeat the operation ( = direct download) for each layer but it’s better to download the file once and load the layers step by step.
# download the file
geopackage_istat_file = "istat_administrative_units_2022.gpkg"
r = requests.get(url, allow_redirects=True)
open(geopackage_istat_file, 'wb').write(r.content)
23621632
regions = gpd.read_file(geopackage_istat_file,layer="regions")
provincies = gpd.read_file(geopackage_istat_file,layer="provincies")
municipalities = gpd.read_file(geopackage_istat_file,layer="municipalities")
macroregions
| COD_RIP | DEN_RIP | Shape_Leng | Shape_Area | geometry | |
|---|---|---|---|---|---|
| 0 | 1 | Nord-Ovest | 2.330183e+06 | 5.792958e+10 | MULTIPOLYGON (((568226.691 4874823.573, 568219... |
| 1 | 2 | Nord-Est | 2.327765e+06 | 6.238509e+10 | MULTIPOLYGON (((618343.929 4893985.661, 618335... |
| 2 | 3 | Centro | 2.010203e+06 | 5.801865e+10 | MULTIPOLYGON (((875952.995 4524692.050, 875769... |
| 3 | 4 | Sud | 2.517097e+06 | 7.377795e+10 | MULTIPOLYGON (((1083358.846 4416348.741, 10833... |
| 4 | 5 | Isole | 2.775538e+06 | 4.991778e+10 | MULTIPOLYGON (((822886.611 3935355.889, 822871... |
monumental trees of Italy
The italian Ministery of Agricultural offers a datasets the location of each monumental tree for each region of Italy.
Visit this page
from a dataframe to a geodataframe
we have a several XLS files with a sheet where there is a column with latitude and another with longitude
It’s also possibile scrape the URL of the XLS file with this code (contribution by Aurora Maria Tumminello)
try:
  import bs4
except ModuleNotFoundError as e:
  !pip install bs4=="4.6.3"
  import bs4
if bs4.__version__ != "4.6.3":
  !pip install -U bs4==4.6.3
  import bs4
# Saving URLs to download Regional data about Monumental Trees
# Get HTML content
html = requests.get("https://www.politicheagricole.it/flex/cm/pages/ServeBLOB.php/L/IT/IDPagina/11260#id-bed7384af14fdba2da436d64155c62b1").content
# Parse the document with BeautifulSoup
soup = bs4.BeautifulSoup(html, 'html.parser')
# Find all elements of the selected class (the ones we're going to download)
regions_urls = soup.findAll("div", {"class": "blob-element-download BLOBAlignLeft"})

# Saving downloading links inside the list
regional_sources=[]
for e in regions_urls:
  regional_sources.append(e.a['href'])
# Enable the support for Excel in Pandas
try:
  import xlrd
except ModuleNotFoundError as e:
  !pip install xlrd=="2.0.1"
  import xlrd
if xlrd.__VERSION__ != "2.0.1":
  !pip install -U xlrd=="2.0.1"
  import xlrd
monumental_trees = pd.read_excel(regional_sources[0])
for idsource in range(1,len(regional_sources)-1):
  monumental_trees = monumental_trees.append(pd.read_excel(regional_sources[idsource]))
investigate the data
monumental_trees.shape[0]
3898
monumental_trees.head(5)
| PROGR | REGIONE | ID SCHEDA | PROVINCIA | COMUNE | LOCALITÀ | LATITUDINE SU GIS | LONGITUDINE SU GIS | ALTITUDINE (m s.l.m.) | CONTESTO URBANO | SPECIE NOME SCIENTIFICO | SPECIE NOME VOLGARE | CIRCONFERENZA FUSTO (cm) | ALTEZZA (m) | CRITERI DI MONUMENTALITÀ | PROPOSTA DICHIARAZIONE NOTEVOLE INTERESSE PUBBLICO | Unnamed: 16 | |
|---|---|---|---|---|---|---|---|---|---|---|---|---|---|---|---|---|---|
| 0 | 1 | ABRUZZO | 01/A235/CH/13 | Chieti | Altino | Le Macchie Articciaro | 42° 05' 14,02'' | 14° 20' 34,97'' | 215.0 | no | Juniperus oxycedrus L. | Ginepro coccolone | 125 | 7 | a) età e/o dimensioni\nb) forma e portamento\n... | no | NaN |
| 1 | 2 | ABRUZZO | 01/A367/CH/13 | Chieti | Archi | Serra Castello | 42° 04' 43,15'' | 14° 22' 57,14'' | 525.0 | no | Arbutus unedo L. | Corbezzolo | 125 | 5.5 | a) età e/o dimensioni\nd) rarità botanica | no | NaN |
| 2 | 3 | ABRUZZO | 01/A485/CH/13 | Chieti | Atessa | Santa Lucia - Piana Sant'Antonio | 42° 06' 41,82'' | 14° 25' 55,52'' | 125.0 | sì | Quercus pubescens Willd. | Roverella | 355 | 17 | a) età e/o dimensioni | no | NaN |
| 3 | 4 | ABRUZZO | 01/A956/CH/13 | Chieti | Bomba | Cementificio - Casale Nasuti | 42° 03' 07,95'' | 14° 21' 48,11'' | 400.0 | no | Quercus pubescens Willd. | Roverella | 530 | 22 | a) età e/o dimensioni\nc) valore ecologico | no | NaN |
| 4 | 5 | ABRUZZO | 02/A956/CH/13 | Chieti | Bomba | Cementificio - Casale Nasuti | 42° 03' 07,11'' | 14° 21' 48,97'' | 400.0 | no | Quercus pubescens Willd. | Roverella | 475 | 21 | a) età e/o dimensioni | no | NaN |
latitude and longitude here are stored in degrees.
Eg.
45° 34’ 23,2’’
you need to transform it in decimal degree:
degree + minutes / 60 + seconds/(60*60)
and assume negative values if the data is in West or South.
here an example code
import re
lat = '''45°34'23.2"N'''
deg, minutes, seconds, direction =  re.split('[°\'"]', lat)
(float(deg) + float(minutes)/60 + float(seconds)/(60*60)) * (-1 if direction in ['W', 'S'] else 1)
45.57311111111112
a good blog post to explain the problem is here

https://www.ubergizmo.com/how-to/read-gps-coordinates/
try:
  import dms2dec
except ModuleNotFoundError as e:
  !pip install dms2dec==0.1
  import dms2dec
Looking in indexes: https://pypi.org/simple, https://us-python.pkg.dev/colab-wheels/public/simple/
Collecting dms2dec==0.1
  Downloading dms2dec-0.1-py3-none-any.whl (3.0 kB)
Installing collected packages: dms2dec
Successfully installed dms2dec-0.1
# dms2dec is an useful library for this conversion
from dms2dec.dms_convert import dms2dec
monumental_trees[monumental_trees['LONGITUDINE SU GIS'] == 761]
| PROGR | REGIONE | ID SCHEDA | PROVINCIA | COMUNE | LOCALITÀ | LATITUDINE SU GIS | LONGITUDINE SU GIS | ALTITUDINE (m s.l.m.) | CONTESTO URBANO | SPECIE NOME SCIENTIFICO | SPECIE NOME VOLGARE | CIRCONFERENZA FUSTO (cm) | ALTEZZA (m) | CRITERI DI MONUMENTALITÀ | PROPOSTA DICHIARAZIONE NOTEVOLE INTERESSE PUBBLICO | Unnamed: 16 | |
|---|---|---|---|---|---|---|---|---|---|---|---|---|---|---|---|---|---|
| 28 | 29 | 01/B287/SR/19 | Siracusa | Buscemi | Corso Vittorio Emanuele 112 | 37° 5' 8,7'' | 14° 53' 3,7'' | 761 | si` | Celtis australis L. | Bagolaro | 525 | 25 | a) eta` e/o dimensioni\nb) forma e portamento | si` | NaN | NaN |
# change commas in dots
monumental_trees['LATITUDINE SU GIS'] = monumental_trees['LATITUDINE SU GIS'].apply(lambda x: x.replace(",", "."))
monumental_trees['LONGITUDINE SU GIS'] = monumental_trees['LONGITUDINE SU GIS'].apply(lambda x: x.replace(",", "."))
---------------------------------------------------------------------------

AttributeError                            Traceback (most recent call last)

<ipython-input-23-f641095537de> in <module>
----> 1 monumental_trees['LONGITUDINE SU GIS'] = monumental_trees['LONGITUDINE SU GIS'].apply(lambda x: x.replace(",", "."))


/usr/local/lib/python3.7/dist-packages/pandas/core/series.py in apply(self, func, convert_dtype, args, **kwargs)
   4355         dtype: float64
   4356         """
-> 4357         return SeriesApply(self, func, convert_dtype, args, kwargs).apply()
   4358
   4359     def _reduce(


/usr/local/lib/python3.7/dist-packages/pandas/core/apply.py in apply(self)
   1041             return self.apply_str()
   1042
-> 1043         return self.apply_standard()
   1044
   1045     def agg(self):


/usr/local/lib/python3.7/dist-packages/pandas/core/apply.py in apply_standard(self)
   1099                     values,
   1100                     f,  # type: ignore[arg-type]
-> 1101                     convert=self.convert_dtype,
   1102                 )
   1103


/usr/local/lib/python3.7/dist-packages/pandas/_libs/lib.pyx in pandas._libs.lib.map_infer()


<ipython-input-23-f641095537de> in <lambda>(x)
----> 1 monumental_trees['LONGITUDINE SU GIS'] = monumental_trees['LONGITUDINE SU GIS'].apply(lambda x: x.replace(",", "."))


AttributeError: 'int' object has no attribute 'replace'
there is a problem … a column is int and not str
# identfy the ID of the column
list(monumental_trees.columns).index("LONGITUDINE SU GIS")+1
8
identify the wrong values
for t in monumental_trees.itertuples():
  if type(t[8]) != str:
    print(t[8])
761
identify the row
badrow = monumental_trees[monumental_trees['LONGITUDINE SU GIS'] == 761]
badrow
| PROGR | REGIONE | ID SCHEDA | PROVINCIA | COMUNE | LOCALITÀ | LATITUDINE SU GIS | LONGITUDINE SU GIS | ALTITUDINE (m s.l.m.) | CONTESTO URBANO | SPECIE NOME SCIENTIFICO | SPECIE NOME VOLGARE | CIRCONFERENZA FUSTO (cm) | ALTEZZA (m) | CRITERI DI MONUMENTALITÀ | PROPOSTA DICHIARAZIONE NOTEVOLE INTERESSE PUBBLICO | Unnamed: 16 | |
|---|---|---|---|---|---|---|---|---|---|---|---|---|---|---|---|---|---|
| 28 | 29 | 01/B287/SR/19 | Siracusa | Buscemi | Corso Vittorio Emanuele 112 | 37° 5' 8,7'' | 14° 53' 3.7'' | 761 | si` | Celtis australis L. | Bagolaro | 525 | 25 | a) eta` e/o dimensioni\nb) forma e portamento | si` | NaN | NaN |
the row is wrong:
the value of REGIONE is wrong ( = Sicilia is the right) and all the others have to translate of one position right
Create a new row
prev_value = ""
row = {}
for column in badrow.columns:
  if column == "PROGR":
    row['PROGR'] = badrow['PROGR'].values[0]
  elif column == "REGIONE":
    row['REGIONE'] = "SICILIA"
    prev_value = badrow[column].values[0]
  else:
    row[column] = prev_value
    prev_value =  badrow[column].values[0]
monumental_trees = monumental_trees.append(pd.DataFrame([row]))
monumental_trees = monumental_trees[monumental_trees['LONGITUDINE SU GIS'] != 761]
# change commas in dots
monumental_trees['LATITUDINE SU GIS'] = monumental_trees['LATITUDINE SU GIS'].apply(lambda x: x.replace(",", "."))
monumental_trees['LONGITUDINE SU GIS'] = monumental_trees['LONGITUDINE SU GIS'].apply(lambda x: x.replace(",", "."))
# create the columns with the information in decimal degree
monumental_trees['latitude'] = monumental_trees['LATITUDINE SU GIS'].apply(lambda x: dms2dec(x))
monumental_trees['longitude'] = monumental_trees['LONGITUDINE SU GIS'].apply(lambda x: dms2dec(x))
monumental_trees.columns
Index(['PROGR', 'REGIONE', 'ID SCHEDA', 'PROVINCIA', 'COMUNE', 'LOCALITÀ',
       'LATITUDINE SU GIS', 'LONGITUDINE SU GIS', 'ALTITUDINE (m s.l.m.)',
       'CONTESTO URBANO', 'SPECIE NOME SCIENTIFICO', 'SPECIE NOME VOLGARE',
       'CIRCONFERENZA FUSTO (cm)', 'ALTEZZA (m)', 'CRITERI DI MONUMENTALITÀ',
       'PROPOSTA DICHIARAZIONE NOTEVOLE INTERESSE PUBBLICO', 'Unnamed: 16',
       'latitude', 'longitude'],
      dtype='object')
# rename some columns
columns= {
   'REGIONE': 'region',
   'PROVINCIA': 'province',
   'COMUNE': 'municipality',
   'LOCALITÀ': 'place',
   'ALTITUDINE (m s.l.m.)':'altitude',
   'CONTESTO URBANO':'urban_place',
   'SPECIE NOME SCIENTIFICO':'species_scientific_name',
   'SPECIE NOME VOLGARE':'species_common_name'
  }
monumental_trees.rename(columns=columns,inplace=True)
# choose only the columns we need
monumental_trees = monumental_trees[['region','province','municipality','place','altitude','urban_place','species_scientific_name','species_common_name','latitude','longitude']]
monumental_trees.region.unique()
array(['ABRUZZO', 'BOLZANO', 'CAMPANIA', 'FRIULI VENEZIA GIULIA',
       'LIGURIA', 'MARCHE', 'PIEMONTE', 'SARDEGNA', 'TOSCANA', 'UMBRIA',
       'VENETO', 'BASILICATA', 'CALABRIA', 'EMILIA-ROMAGNA', 'LAZIO',
       'LOMBARDIA', 'MOLISE', 'PUGLIA', 'SICILIA', 'TRENTO'], dtype=object)
geodataframe creation from the dataframe with x (longitude) and y (latitude)
GeoDataFrame constructor:
- a dataframe (or dictionary)
- the CRS
- a geometry field expressed in WKT (eg. POINT (1,3))
now we are ready to create the geodataframe. the operation are:
- creation of a geometry column based on the WKT syntax
- transform the DataFrame in GeoDataFrame
geo_monumental_trees = gpd.GeoDataFrame(
    monumental_trees,
    crs='EPSG:4326',
    geometry=gpd.points_from_xy(monumental_trees.longitude, monumental_trees.latitude))
geo_monumental_trees.to_file("geo_monumental_trees.geojson",driver="GeoJSON")
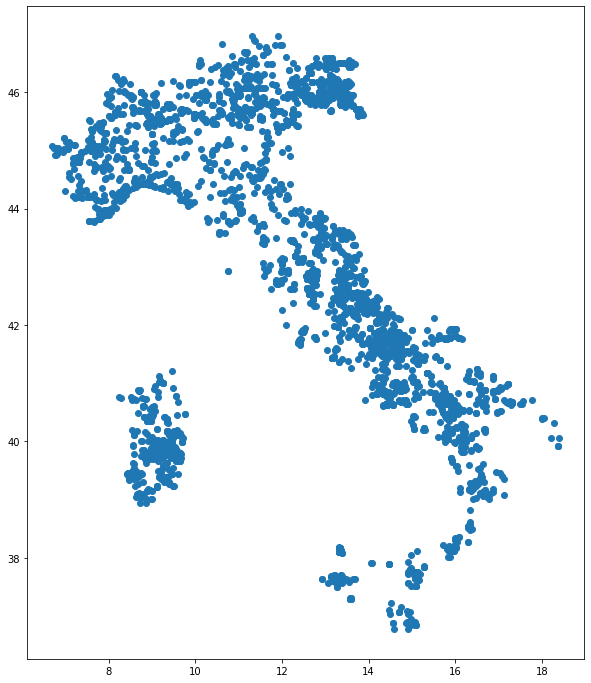
geo_monumental_trees.plot(figsize=(12,12))
plt.show()
macroregions.plot()
plt.show()

overlay the layers
ax = macroregions.plot(edgecolor='k', facecolor='none', figsize=(15, 10))
geo_monumental_trees.plot(ax=ax,color="green")
plt.show()
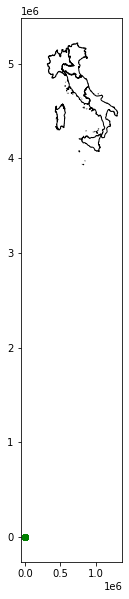
ERROR!
We need to use the same projection!!!
The projection used in our geodataframe of ISTAT is EPSG:32632
macroregions.crs
<Projected CRS: EPSG:32632>
Name: WGS 84 / UTM zone 32N
Axis Info [cartesian]:
- E[east]: Easting (metre)
- N[north]: Northing (metre)
Area of Use:
- name: Between 6°E and 12°E, northern hemisphere between equator and 84°N, onshore and offshore. Algeria. Austria. Cameroon. Denmark. Equatorial Guinea. France. Gabon. Germany. Italy. Libya. Liechtenstein. Monaco. Netherlands. Niger. Nigeria. Norway. Sao Tome and Principe. Svalbard. Sweden. Switzerland. Tunisia. Vatican City State.
- bounds: (6.0, 0.0, 12.0, 84.0)
Coordinate Operation:
- name: UTM zone 32N
- method: Transverse Mercator
Datum: World Geodetic System 1984 ensemble
- Ellipsoid: WGS 84
- Prime Meridian: Greenwich
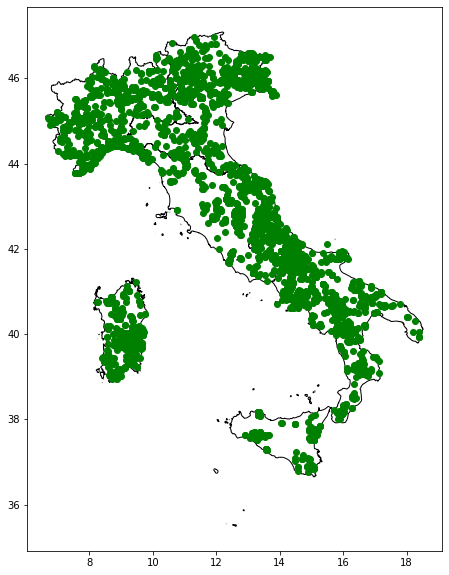
overlay the layers by using the same projection
ax = macroregions.to_crs(epsg=4326).plot(edgecolor='k', facecolor='none', figsize=(15, 10))
geo_monumental_trees.plot(ax=ax,color="green")
plt.show()
Spatial relationships
how two spatial objects relate to each other

from https://en.wikipedia.org/wiki/Spatial_relation
Relationships between individual objects
Eg.
Is this tree located in the north-east Italian macro-region?
we need the north-east italian macro-region in wgs84
macroregions
| COD_RIP | DEN_RIP | Shape_Leng | Shape_Area | geometry | |
|---|---|---|---|---|---|
| 0 | 1 | Nord-Ovest | 2.330183e+06 | 5.792958e+10 | MULTIPOLYGON (((568226.691 4874823.573, 568219... |
| 1 | 2 | Nord-Est | 2.327765e+06 | 6.238509e+10 | MULTIPOLYGON (((618343.929 4893985.661, 618335... |
| 2 | 3 | Centro | 2.010203e+06 | 5.801865e+10 | MULTIPOLYGON (((875952.995 4524692.050, 875769... |
| 3 | 4 | Sud | 2.517097e+06 | 7.377795e+10 | MULTIPOLYGON (((1083358.846 4416348.741, 10833... |
| 4 | 5 | Isole | 2.775538e+06 | 4.991778e+10 | MULTIPOLYGON (((822886.611 3935355.889, 822871... |
macroregions.geometry[1]

northeast = macroregions.to_crs(epsg=4326).geometry[1]
northeast

let’s start with just one point
so we will choose a library in Trento (north east italy)
geo_monumental_trees[geo_monumental_trees.municipality == 'Trento'].head(5)
| region | province | municipality | place | altitude | urban_place | species_scientific_name | species_common_name | latitude | longitude | geometry | |
|---|---|---|---|---|---|---|---|---|---|---|---|
| 65 | TRENTO | Trento | Trento | Povo - Ex-Villa Thun - Piazza Manci 15 | 405 | sì | Sequoiadendron giganteum (Lindl.) J. Buchholz | Sequoia gigante | 46.065997 | 11.155264 | POINT (11.15526 46.06600) |
| 66 | TRENTO | Trento | Trento | Maderno - Villa Maria | 488 | sì | Aesculus hippocastanum L. | Ippocastano | 46.090008 | 11.140311 | POINT (11.14031 46.09001) |
| 67 | TRENTO | Trento | Trento | Povo - Villa Lubich | 455 | sì | Sequoiadendron giganteum (Lindl.) J. Buchholz | Sequoia gigante | 46.066589 | 11.160269 | POINT (11.16027 46.06659) |
| 68 | TRENTO | Trento | Trento | P. Sso Cimirlo - Casare | 790 | no | Prunus avium L. | Ciliegio selvatico | 46.064825 | 11.186625 | POINT (11.18662 46.06482) |
| 69 | TRENTO | Trento | Trento | Malga Brigolina | 943 | no | Fagus sylvatica L. | Faggio | 46.059850 | 11.061781 | POINT (11.06178 46.05985) |
we choose the first line and extrac the geometry
monumental_tree_in_trento = geo_monumental_trees[geo_monumental_trees.municipality == 'Trento'].head(1).geometry.values[0]
monumental_tree_in_trento

within relation
in our case:
it’s the point inside the area?
monumental_tree_in_trento.within(northeast)
True
contain relation
in our case:
does the area contain the point?
northeast.contains(monumental_tree_in_trento)
True
we can iterate the operation for each point
very slow!
.. so we work with an only one point
monumental_trees_northeast = geo_monumental_trees[geo_monumental_trees.within(northeast)]
%time
CPU times: user 2 µs, sys: 0 ns, total: 2 µs
Wall time: 5.01 µs
monumental_trees_northeast.shape
(943, 11)
monumental_trees_northeast.region.unique()
array(['BOLZANO', 'FRIULI VENEZIA GIULIA', 'MARCHE', 'VENETO',
       'EMILIA-ROMAGNA', 'TRENTO'], dtype=object)
.. MARCHE isn’t a region of the North-East Italy
monumental_trees_northeast[monumental_trees_northeast.region == "MARCHE"]
| region | province | municipality | place | altitude | urban_place | species_scientific_name | species_common_name | latitude | longitude | geometry | |
|---|---|---|---|---|---|---|---|---|---|---|---|
| 117 | MARCHE | Pesaro e Urbino | Sassofeltrio | Ca' Micci | 570.0 | sì | Morus nigra L. | Gelso nero | 43.886681 | 12.439531 | POINT (12.43953 43.88668) |
tree_marche = monumental_trees_northeast[monumental_trees_northeast.region == "MARCHE"]
regions[regions.DEN_REG=='Marche'].to_crs(epsg=4326).bounds
| minx | miny | maxx | maxy | |
|---|---|---|---|---|
| 10 | 12.185454 | 42.687156 | 13.916725 | 43.968635 |
municipalities[municipalities.COMUNE=="Sassofeltrio"]
| COD_RIP | COD_REG | COD_PROV | COD_CM | COD_UTS | PRO_COM | PRO_COM_T | COMUNE | COMUNE_A | CC_UTS | Shape_Leng | Shape_Area | geometry | |
|---|---|---|---|---|---|---|---|---|---|---|---|---|---|
| 7533 | 2 | 8 | 99 | 0 | 99 | 99031 | 099031 | Sassofeltrio | None | 0 | 29089.196723 | 2.152137e+07 | MULTIPOLYGON (((777501.672 4865896.297, 777688... |
regions[regions.COD_REG==8].DEN_REG.values[0]
'Emilia-Romagna'
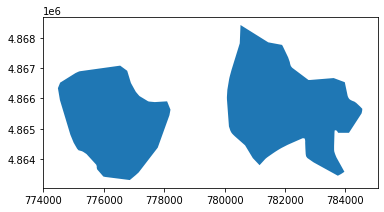
municipalities[municipalities.COMUNE=="Sassofeltrio"].plot()
plt.show()
ax = regions[regions.COD_REG==8].plot(edgecolor='black', facecolor='none', figsize=(15, 10))
municipalities[municipalities.COMUNE=="Sassofeltrio"].plot(ax=ax,color="red")
regions[regions.DEN_REG=='Marche'].plot(ax=ax,edgecolor='blue',facecolor='none')
plt.show()
Here the reason

REFERENCE
Overview of the different functions to check spatial relationships (spatial predicate functions):
equalscontainscrossesdisjointintersectsoverlapstoucheswithincovers
See predicates-and-relationships for an overview of those methods.
See https://en.wikipedia.org/wiki/DE-9IM for all details on the semantics of those operations.
Spatial Joins
You can create a join like the usual join between pandas dataframe by using a spatial relationship with the function geopandas.sjoin
monumental_trees_and_macroregions = gpd.sjoin(macroregions.to_crs(epsg=4326),
                          geo_monumental_trees, how='inner', predicate='contains', lsuffix='macroregions_', rsuffix='trees')
%time
CPU times: user 2 µs, sys: 0 ns, total: 2 µs
Wall time: 4.53 µs
monumental_trees_and_macroregions.columns
Index(['COD_RIP', 'DEN_RIP', 'Shape_Leng', 'Shape_Area', 'geometry',
       'index_trees', 'region', 'province', 'municipality', 'place',
       'altitude', 'urban_place', 'species_scientific_name',
       'species_common_name', 'latitude', 'longitude'],
      dtype='object')
monumental_trees_and_macroregions.shape
(3892, 16)
monumental_trees_and_macroregions.head(5)
| COD_RIP | DEN_RIP | Shape_Leng | Shape_Area | geometry | index_trees | region | province | municipality | place | altitude | urban_place | species_scientific_name | species_common_name | latitude | longitude | |
|---|---|---|---|---|---|---|---|---|---|---|---|---|---|---|---|---|
| 0 | 1 | Nord-Ovest | 2.330183e+06 | 5.792958e+10 | MULTIPOLYGON (((9.85132 44.02340, 9.85122 44.0... | 142 | LOMBARDIA | Mantova | Revere | Via Giulio Romano 40 | 15.0 | sì | Populus nigra L. | Pioppo nero | 45.048556 | 11.126000 |
| 0 | 1 | Nord-Ovest | 2.330183e+06 | 5.792958e+10 | MULTIPOLYGON (((9.85132 44.02340, 9.85122 44.0... | 37 | LOMBARDIA | Brescia | Borgosatollo | Piffione | 113.0 | no | Insieme omogeneo di Morus alba L. | Gelso bianco | 45.489339 | 10.239456 |
| 0 | 1 | Nord-Ovest | 2.330183e+06 | 5.792958e+10 | MULTIPOLYGON (((9.85132 44.02340, 9.85122 44.0... | 36 | LOMBARDIA | Brescia | Borgosatollo | Piffione | 133.0 | no | Insieme omogeneo di Morus nigra L. | Gelso nero | 45.491389 | 10.243056 |
| 0 | 1 | Nord-Ovest | 2.330183e+06 | 5.792958e+10 | MULTIPOLYGON (((9.85132 44.02340, 9.85122 44.0... | 60 | LOMBARDIA | Brescia | Mazzano | Via Patuzza 13 | 158.0 | no | Insieme omogeneo di Cedrus libani A.Richard | Cedro del Libano | 45.510969 | 10.376208 |
| 0 | 1 | Nord-Ovest | 2.330183e+06 | 5.792958e+10 | MULTIPOLYGON (((9.85132 44.02340, 9.85122 44.0... | 39 | LOMBARDIA | Brescia | Brescia | Istituto Palazzolo | 135.0 | si` | Cedrus libani A.Richard | Cedro del Libano | 45.519167 | 10.216111 |
monumental_trees_and_macroregions.geom_type.unique()
array(['MultiPolygon'], dtype=object)
… and now you can investigate the new geodataframe
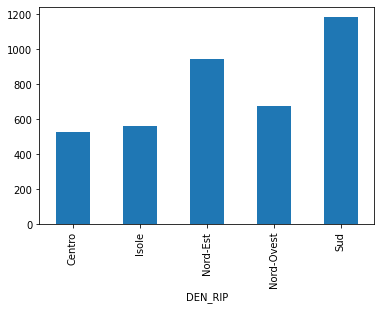
monumental_trees_and_macroregions.groupby(['DEN_RIP']).index_trees.count()
DEN_RIP
Centro         525
Isole          564
Nord-Est       943
Nord-Ovest     677
Sud           1183
Name: index_trees, dtype: int64
monumental_trees_and_macroregions.groupby(['DEN_RIP']).index_trees.count().plot(kind='bar')
plt.show()
SPATIAL JOIN = transferring attributes from one layer to another based on their spatial relationship
Different parts of this operations:
- The GeoDataFrame to which we want add information
- The GeoDataFrame that contains the information we want to add
- The spatial relationship we want to use to match both datasets ('intersects', 'contains', 'within')
- The type of join: left or inner join
Spatial operations
GeoPandas provide analysis methods that return new geometric objects (based on shapely)
See https://shapely.readthedocs.io/en/stable/manual.html#spatial-analysis-methods for more details.
buffer
object.buffer(distance, resolution=16, cap_style=1, join_style=1, mitre_limit=5.0)
Returns an approximate representation of all points within a given distance of the this geometric object.
monumental_tree_in_trento_32632 = geo_monumental_trees[geo_monumental_trees.municipality == 'Trento'].to_crs(32632).geometry.values[0]
monumental_tree_in_trento_32632
monumental_tree_in_trento_32632.buffer(9000) # a circle with a ray of 9000 meters
due to the algorithm with which the buffer is built, as the value increases, from whatever geometry one starts, the result will take on more and more the shape of a circumference.
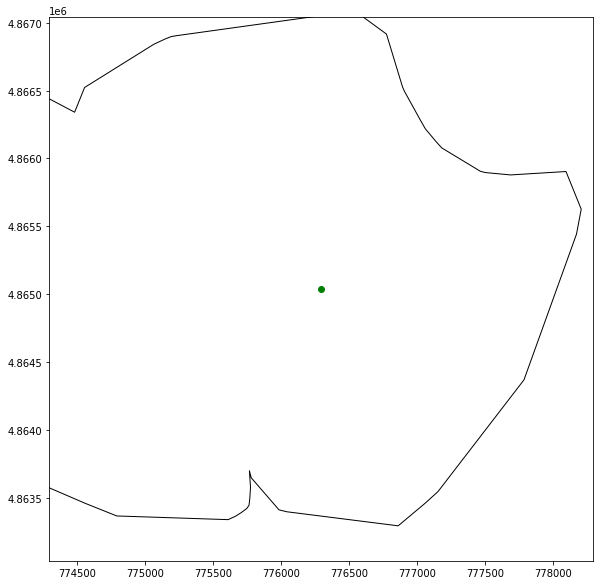
the tree in Marche?
minx, miny, maxx, maxy = tree_marche.to_crs(epsg=32632).buffer(2000).total_bounds
ax = regions[regions.DEN_REG=="Emilia-Romagna"].plot(edgecolor='black', facecolor='none', figsize=(15, 10))
ax.set_xlim(minx, maxx)
ax.set_ylim(miny, maxy)
tree_marche.to_crs(epsg=32632).plot(ax=ax, color="green")
plt.show()
simplify
object.simplify(tolerance, preserve_topology=True)
Returns a simplified representation of the geometric object.
northeast_geometry = macroregions[macroregions.COD_RIP==2].geometry.values[0]
northeast_geometry

northeast_geometry.simplify(10000,preserve_topology=False)

Es. symmetric_difference
object.symmetric_difference(other)
Returns a representation of the points in this object not in the other geometric object, and the points in the other not in this geometric object.
northeast_geometry.simplify(10000,preserve_topology=False).symmetric_difference(monumental_tree_in_trento_32632.buffer(9000))

REMEMBER:
GeoPandas (and Shapely for the individual objects) provides a whole lot of basic methods to analyse the geospatial data (distance, length, centroid, boundary, convex_hull, simplify, transform, ….), much more than the few that we can touch in this tutorial.
- An overview of all methods provided by GeoPandas can be found here: https://geopandas.readthedocs.io/en/latest/docs/reference.html
Clip
Extracts input features that overlay the clip features.

geopandas.clip(gdf, mask, keep_geom_type=False)
gdf = geodataframe
mask = polygon
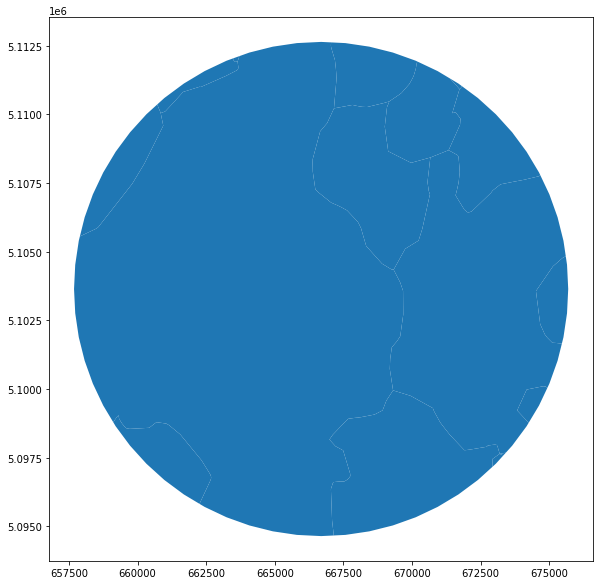
municipalities_inside_circle = municipalities.clip(monumental_tree_in_trento_32632.buffer(9000))
municipalities_inside_circle.COMUNE.unique()
array(['Caldonazzo', 'Altopiano della Vigolana', 'Calceranica al Lago',
       'Tenna', 'Garniga Terme', 'Vignola-Falesina', 'Pergine Valsugana',
       'Trento', 'Civezzano', 'Vallelaghi', 'Fornace', 'Baselga di Pinè',
       'Albiano', 'Lavis', 'Lona-Lases', 'Giovo'], dtype=object)
municipalities_inside_circle.plot(figsize=(10,10))
plt.show()
Aggregation with dissolve
Spatial data are often more granular than we need. For example, we have the data of the macro-regions but we don’t have a geometry with the border of Italy.
If we have a columns to operate a groupby we can solve it but to create the geometry we need the function dissolve.
macroregions['nation']='italy'
macroregions
| COD_RIP | DEN_RIP | Shape_Leng | Shape_Area | geometry | nation | |
|---|---|---|---|---|---|---|
| 0 | 1 | Nord-Ovest | 2.330183e+06 | 5.792958e+10 | MULTIPOLYGON (((568226.691 4874823.573, 568219... | italy |
| 1 | 2 | Nord-Est | 2.327765e+06 | 6.238509e+10 | MULTIPOLYGON (((618343.929 4893985.661, 618335... | italy |
| 2 | 3 | Centro | 2.010203e+06 | 5.801865e+10 | MULTIPOLYGON (((875952.995 4524692.050, 875769... | italy |
| 3 | 4 | Sud | 2.517097e+06 | 7.377795e+10 | MULTIPOLYGON (((1083358.846 4416348.741, 10833... | italy |
| 4 | 5 | Isole | 2.775538e+06 | 4.991778e+10 | MULTIPOLYGON (((822886.611 3935355.889, 822871... | italy |
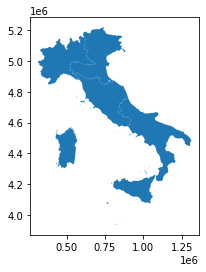
italy = macroregions[['nation', 'geometry']]
italy.plot()
plt.show()
italy = italy.to_crs(epsg=4326).dissolve(by='nation')
%time
CPU times: user 6 µs, sys: 1e+03 ns, total: 7 µs
Wall time: 9.78 µs
italy
| geometry | |
|---|---|
| nation | |
| italy | MULTIPOLYGON (((8.41239 38.86127, 8.41215 38.8... |
italy.geometry[0]

italy.to_crs(epsg=32632).geometry[0]

REMEMBER:
dissolve can be thought of as doing three things: (a) it dissolves all the geometries within a given group together into a single geometric feature (using the unary_union method), and (b) it aggregates all the rows of data in a group using groupby.aggregate(), and (c) it combines those two results.
An overview of all methods provided by GeoPandas can be found here: http://geopandas.org/aggregation_with_dissolve.html
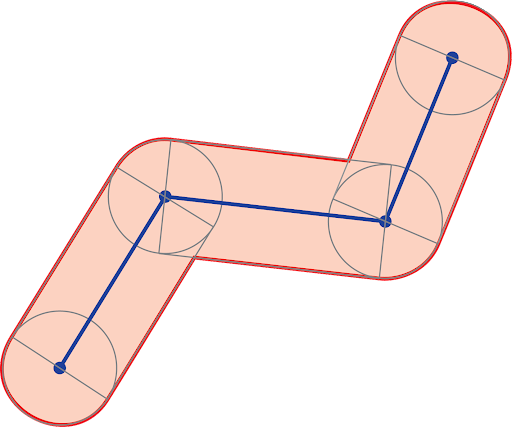
Overlay
Spatial overlays allow you to compare two GeoDataFrames containing polygon or multipolygon geometries and create a new GeoDataFrame with the new geometries representing the spatial combination and merged properties. This allows you to answer questions like
What are the demographics of the census tracts within 90km from a point?
The basic idea is demonstrated by the graphic below but keep in mind that overlays operate at the dataframe level, not on individual geometries, and the properties from both are retained
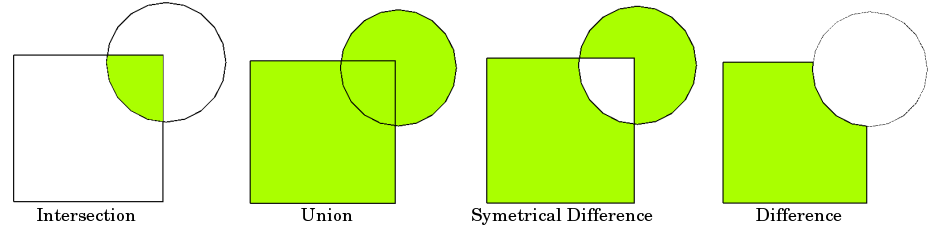
source: https://geopandas.org/gallery/overlays.html
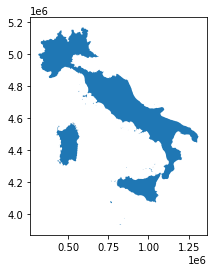
macroregion_gdf = macroregions[macroregions.COD_RIP==2].to_crs(epsg=32632)
overlay = italy.to_crs(epsg=32632).overlay(macroregion_gdf, how="difference")
overlay.plot()
plt.show()
Exercise
1 - create the geodataframe of the gas&oil stations of Italy
- data from the italian Ministry of Economic Development
- count the total of the gas&oil stations for each muncipality of Trentino
2 - identify the difference of municipalities in Trentino in the year 2019 with the year 2021
- identify which municipalities are created from aggregation to others
- find the biggest new municipality of Trentino and show all the italian municipalities with bordering it
- create the macroarea of all the municipalities bordering with it
- for each gas&oil station in the macro-area, calculate how many monumental trees have been within a 500m radius
3 - create a polygon that contains all the monumental trees inside the area
- identify all the gas&oil stations in this area which are within 2km of each other
- save the polygon in geopackage with the attribute “description” with the name of the filling station
4 - create the polygon of the Island of Elba from the layer of municipalities with functions of overlay