Solution 06
A funny story
Channon Perry and her boyfriend analysed their personal GPS traces to find ‘missed potential fateful encounters’ in the past.
Setup
try:
  import pygeos
except ModuleNotFoundError as e:
  !pip install pygeos==0.13
  import pygeos

if pygeos.__version__ != "0.13":
  !pip install -U pygeos==0.13
try:
  import movingpandas as mpd
except ModuleNotFoundError as e:
  !pip install movingpandas=="0.7.rc1"
  import movingpandas as mpd

if mpd.__version__ != "0.7.rc1":
  !pip install -U movingpandas==0.7.rc1
/home/napo/.local/lib/python3.10/site-packages/geopandas/_compat.py:123: UserWarning: The Shapely GEOS version (3.11.0dev-CAPI-1.16.0) is incompatible with the GEOS version PyGEOS was compiled with (3.10.3-CAPI-1.16.1). Conversions between both will be slow.
  warnings.warn(
try:
  import pyrosm
except ModuleNotFoundError as e:
  !pip install pyrosm==0.6.1
  import pyrosm
try:
  import geojson
except ModuleNotFoundError as e:
  !pip install geojson==2.5.0
  import geojson
if geojson.__version__ != "2.5.0":
  !pip install -U geojson==2.5.0
  import geojson
try:
  import osmnx  as ox
except ModuleNotFoundError as e:
  !pip install osmnx==1.2.2
  import osmnx  as ox
if ox.__version__ != "1.2.2":
  !pip install -U osmnx==1.2.2
  import osmnx  as ox
this tutorial include also the Fast Map Matching
For this package you have to follow the instruction on the official website
import pandas as pd
import geopandas as gpd
import movingpandas as mpd
from shapely.geometry import Polygon
from shapely import wkt
import os
import numpy as np
import osmnx as ox
import warnings
warnings.simplefilter("ignore")
from matplotlib import pyplot as plt
Exercise
the trips_truck.gpkg dataset contains the routes of a garbage vehicle in April 2018.
Based on this data:
- identify the longest route carried out
- identify the places of the daily departure and arrival points
- show the km traveled day by day
- identify the breaks carried out in the shortest route of the third week and in the longest one of the last
- identify the longest route of the third week of the month on the OpenStreetMap road graph
Download the data
truck = gpd.read_file("https://github.com/napo/geospatial_course_unitn/raw/master/data/geotemporaldata/trips_truck.gpkg")
truck.head(5)
| vehicleid | latitude | longitude | timestamp | geometry | |
|---|---|---|---|---|---|
| 0 | 8867 | 45.177197 | 11.057768 | 2018-04-01 00:00:27+00:00 | POINT (11.05777 45.17720) |
| 1 | 8867 | 45.177198 | 11.057855 | 2018-04-01 02:00:28+00:00 | POINT (11.05785 45.17720) |
| 2 | 8867 | 45.177232 | 11.057655 | 2018-04-01 02:04:13+00:00 | POINT (11.05766 45.17723) |
| 3 | 8867 | 45.177212 | 11.057705 | 2018-04-01 03:00:28+00:00 | POINT (11.05771 45.17721) |
| 4 | 8867 | 45.177278 | 11.057865 | 2018-04-01 04:00:28+00:00 | POINT (11.05786 45.17728) |
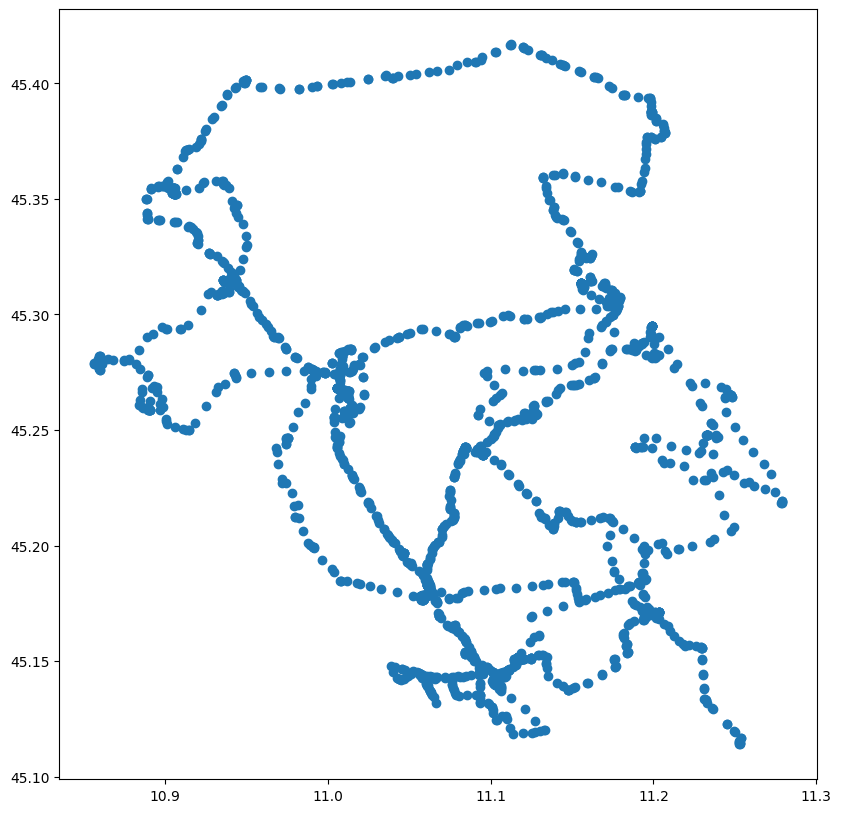
truck.plot(figsize=(10,10))
plt.show()
type(truck['timestamp'][0])
pandas._libs.tslibs.timestamps.Timestamp
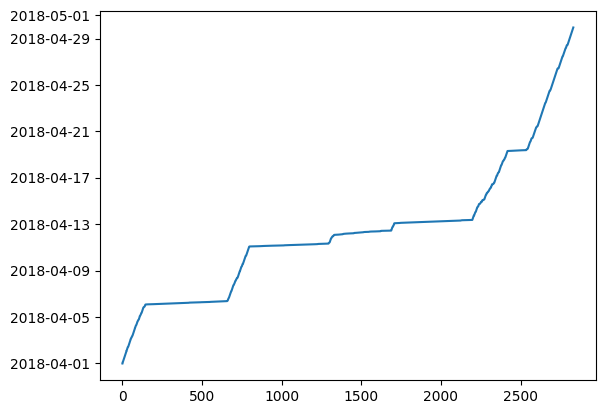
truck['timestamp'] = pd.to_datetime(truck['timestamp'], format='%Y-%m-%d %H:%M:%S')
truck['timestamp'].plot()
plt.show()
truck['timestamp'].min()
Timestamp('2018-04-01 00:00:27+0000', tz='UTC')
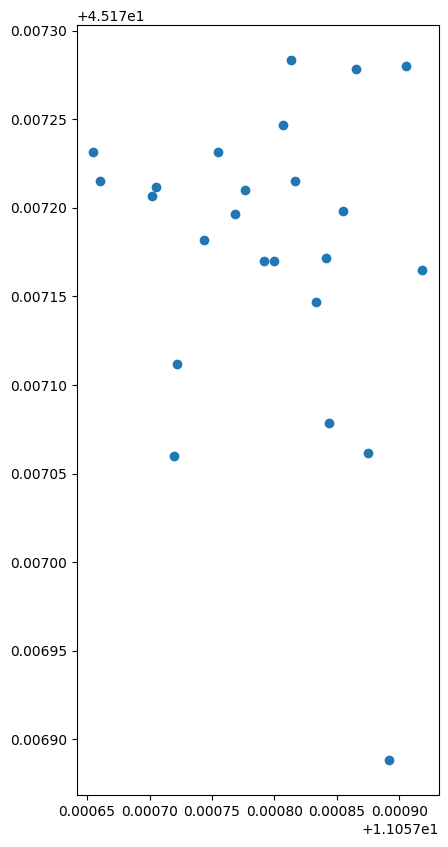
truck[(truck['timestamp'] >= '2018-04-01') & (truck['timestamp'] < '2018-04-02')].plot(figsize =(10,10))
plt.show()
truck['weekday'] = truck['timestamp'].apply(lambda x: x.weekday())
truck.weekday.unique()
# Monday == 0 … Sunday == 6
array([6, 0, 1, 2, 3, 4, 5])
def weekday_to_string(weekday):
    if weekday == 0:
        return 'Monday'
    elif weekday == 1:
        return 'Tuesday'
    elif weekday == 2:
        return 'Wednesday'
    elif weekday == 3:
        return 'Thursday'
    elif weekday == 4:
        return 'Friday'
    elif weekday == 5:
        return 'Saturday'
    elif weekday == 6:
        return 'Sunday'
truck['weekday_name'] = truck['weekday'].apply(lambda x: weekday_to_string(x))
truck.head(5)
| vehicleid | latitude | longitude | timestamp | geometry | weekday | weekday_name | |
|---|---|---|---|---|---|---|---|
| 0 | 8867 | 45.177197 | 11.057768 | 2018-04-01 00:00:27+00:00 | POINT (11.05777 45.17720) | 6 | Sunday |
| 1 | 8867 | 45.177198 | 11.057855 | 2018-04-01 02:00:28+00:00 | POINT (11.05785 45.17720) | 6 | Sunday |
| 2 | 8867 | 45.177232 | 11.057655 | 2018-04-01 02:04:13+00:00 | POINT (11.05766 45.17723) | 6 | Sunday |
| 3 | 8867 | 45.177212 | 11.057705 | 2018-04-01 03:00:28+00:00 | POINT (11.05771 45.17721) | 6 | Sunday |
| 4 | 8867 | 45.177278 | 11.057865 | 2018-04-01 04:00:28+00:00 | POINT (11.05786 45.17728) | 6 | Sunday |
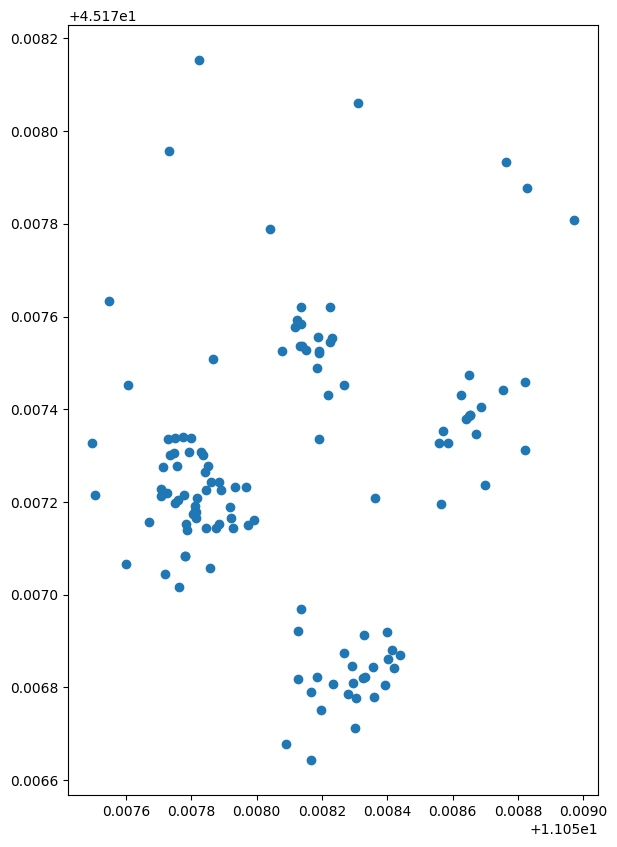
truck[truck.weekday == 0].plot(figsize=(10,10))
plt.show()
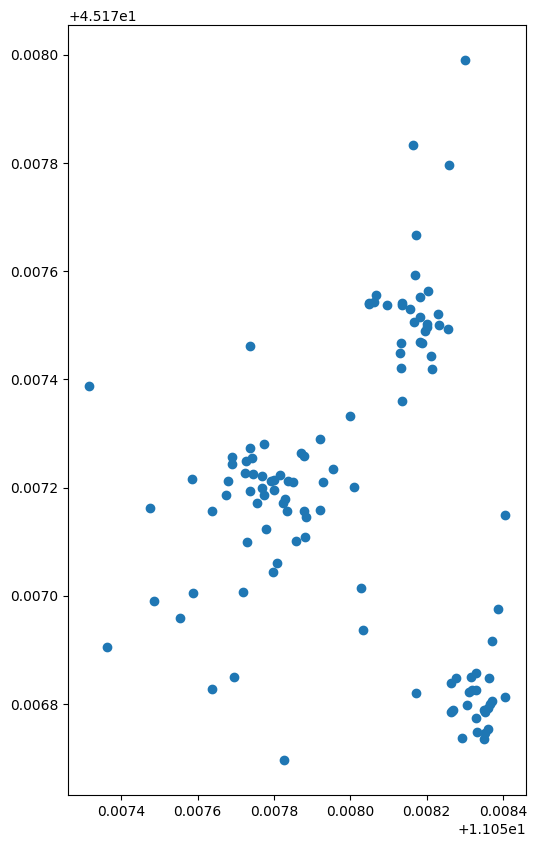
truck[truck.weekday == 1].plot(figsize =(10,10))
plt.show()
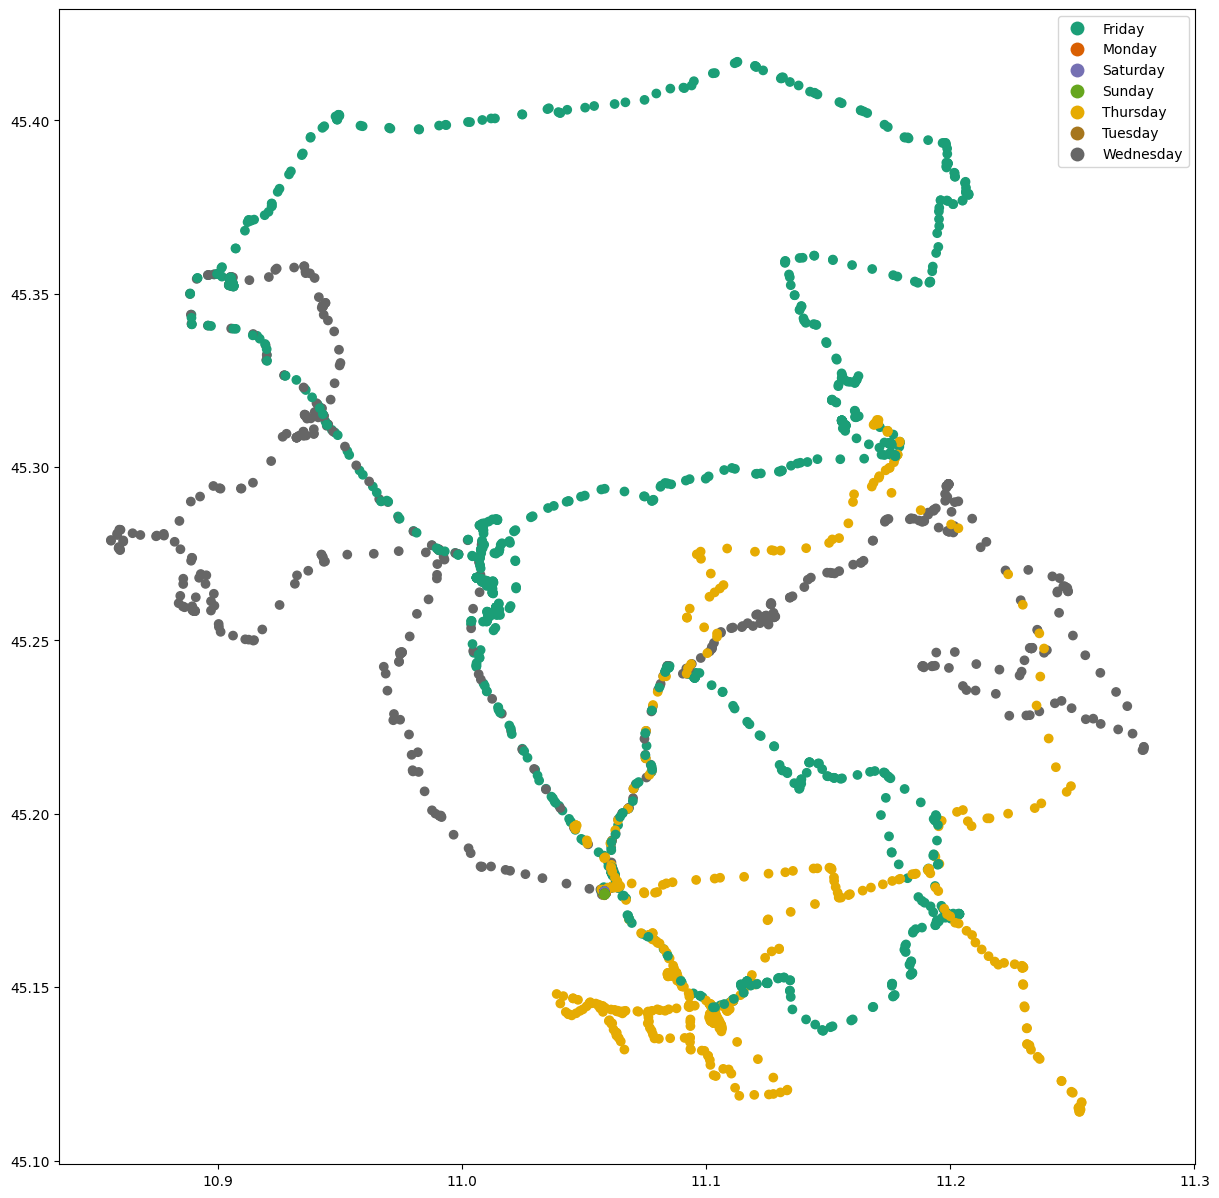
truck.plot(column='weekday_name', cmap="Dark2", legend=True,figsize=(15,15))
plt.show()
truck['day'] = truck['timestamp'].apply(lambda x: x.strftime("%Y-%m-%d"))
truck.head(3)
| vehicleid | latitude | longitude | timestamp | geometry | weekday | weekday_name | day | |
|---|---|---|---|---|---|---|---|---|
| 0 | 8867 | 45.177197 | 11.057768 | 2018-04-01 00:00:27+00:00 | POINT (11.05777 45.17720) | 6 | Sunday | 2018-04-01 |
| 1 | 8867 | 45.177198 | 11.057855 | 2018-04-01 02:00:28+00:00 | POINT (11.05785 45.17720) | 6 | Sunday | 2018-04-01 |
| 2 | 8867 | 45.177232 | 11.057655 | 2018-04-01 02:04:13+00:00 | POINT (11.05766 45.17723) | 6 | Sunday | 2018-04-01 |
identify the longest route carried out
we need to create the trajectory day by day
# to use in movingpandas
truck = truck.set_index('timestamp').tz_localize(None)
# this trajectory contains all the points of the truck
trajectory = mpd.Trajectory(truck,"vehiclesid")
trajectory.add_speed()
trajectory.add_direction()
trajectory.df.head(5)
| vehicleid | latitude | longitude | geometry | weekday | weekday_name | day | speed | prev_pt | direction | |
|---|---|---|---|---|---|---|---|---|---|---|
| timestamp | ||||||||||
| 2018-04-01 00:00:27 | 8867 | 45.177197 | 11.057768 | POINT (11.05777 45.17720) | 6 | Sunday | 2018-04-01 | 0.000946 | None | 88.437276 |
| 2018-04-01 02:00:28 | 8867 | 45.177198 | 11.057855 | POINT (11.05785 45.17720) | 6 | Sunday | 2018-04-01 | 0.000946 | POINT (11.05777 45.17720) | 88.437276 |
| 2018-04-01 02:04:13 | 8867 | 45.177232 | 11.057655 | POINT (11.05766 45.17723) | 6 | Sunday | 2018-04-01 | 0.071783 | POINT (11.05785 45.17720) | 283.302496 |
| 2018-04-01 03:00:28 | 8867 | 45.177212 | 11.057705 | POINT (11.05771 45.17721) | 6 | Sunday | 2018-04-01 | 0.001338 | POINT (11.05766 45.17723) | 119.572435 |
| 2018-04-01 04:00:28 | 8867 | 45.177278 | 11.057865 | POINT (11.05786 45.17728) | 6 | Sunday | 2018-04-01 | 0.004055 | POINT (11.05771 45.17721) | 59.413161 |
we need a collection of trajectories base on the timestamp of the vehicle
traj_collection = mpd.TrajectoryCollection(trajectory.to_point_gdf(), 'vehicleid',"timestamp¨")
and day by day
daily = mpd.TemporalSplitter(traj_collection).split(mode='day')
daily
TrajectoryCollection with 29 trajectories
calculate the length of each path
daily_lengths = [traj.get_length() for traj in daily]
and add the starting day
daily_t = [traj.get_start_time() for traj in daily]
daily_t
[datetime.datetime(2018, 4, 1, 0, 0, 27),
 datetime.datetime(2018, 4, 2, 0, 0, 28),
 datetime.datetime(2018, 4, 3, 0, 0, 25),
 datetime.datetime(2018, 4, 4, 0, 0, 26),
 datetime.datetime(2018, 4, 5, 0, 0, 27),
 datetime.datetime(2018, 4, 6, 0, 0, 29),
 datetime.datetime(2018, 4, 7, 0, 0, 25),
 datetime.datetime(2018, 4, 8, 0, 0, 28),
 datetime.datetime(2018, 4, 9, 0, 0, 27),
 datetime.datetime(2018, 4, 10, 0, 0, 27),
 datetime.datetime(2018, 4, 11, 0, 0, 27),
 datetime.datetime(2018, 4, 12, 0, 0, 27),
 datetime.datetime(2018, 4, 13, 0, 0, 27),
 datetime.datetime(2018, 4, 14, 0, 52, 11),
 datetime.datetime(2018, 4, 15, 0, 0, 24),
 datetime.datetime(2018, 4, 16, 0, 0, 30),
 datetime.datetime(2018, 4, 17, 0, 0, 29),
 datetime.datetime(2018, 4, 18, 0, 0, 29),
 datetime.datetime(2018, 4, 19, 0, 0, 29),
 datetime.datetime(2018, 4, 20, 0, 0, 30),
 datetime.datetime(2018, 4, 21, 0, 0, 29),
 datetime.datetime(2018, 4, 22, 0, 0, 29),
 datetime.datetime(2018, 4, 23, 0, 0, 29),
 datetime.datetime(2018, 4, 24, 0, 0, 30),
 datetime.datetime(2018, 4, 25, 0, 0, 28),
 datetime.datetime(2018, 4, 26, 0, 0, 29),
 datetime.datetime(2018, 4, 27, 0, 0, 29),
 datetime.datetime(2018, 4, 28, 0, 0, 27),
 datetime.datetime(2018, 4, 29, 0, 0, 27)]
transform the daily_lenghts in a dataframe to obtain the max length
rows = {}
rows['length'] =  daily_lengths
rows['day'] = daily_t
daily_lengths = pd.DataFrame(rows)
daily_lengths
| length | day | |
|---|---|---|
| 0 | 281.801011 | 2018-04-01 00:00:27 |
| 1 | 414.089055 | 2018-04-02 00:00:28 |
| 2 | 498.681155 | 2018-04-03 00:00:25 |
| 3 | 754.454242 | 2018-04-04 00:00:26 |
| 4 | 738.204809 | 2018-04-05 00:00:27 |
| 5 | 167779.977302 | 2018-04-06 00:00:29 |
| 6 | 700.033183 | 2018-04-07 00:00:25 |
| 7 | 640.248828 | 2018-04-08 00:00:28 |
| 8 | 479.058474 | 2018-04-09 00:00:27 |
| 9 | 594.202797 | 2018-04-10 00:00:27 |
| 10 | 160781.185020 | 2018-04-11 00:00:27 |
| 11 | 98034.924751 | 2018-04-12 00:00:27 |
| 12 | 156337.099504 | 2018-04-13 00:00:27 |
| 13 | 1303.027725 | 2018-04-14 00:52:11 |
| 14 | 1902.285121 | 2018-04-15 00:00:24 |
| 15 | 1003.769563 | 2018-04-16 00:00:30 |
| 16 | 450.866303 | 2018-04-17 00:00:29 |
| 17 | 428.084691 | 2018-04-18 00:00:29 |
| 18 | 48754.431074 | 2018-04-19 00:00:29 |
| 19 | 324.761731 | 2018-04-20 00:00:30 |
| 20 | 490.592498 | 2018-04-21 00:00:29 |
| 21 | 340.601450 | 2018-04-22 00:00:29 |
| 22 | 342.066707 | 2018-04-23 00:00:29 |
| 23 | 318.429337 | 2018-04-24 00:00:30 |
| 24 | 311.897231 | 2018-04-25 00:00:28 |
| 25 | 314.383396 | 2018-04-26 00:00:29 |
| 26 | 289.669857 | 2018-04-27 00:00:29 |
| 27 | 343.704574 | 2018-04-28 00:00:27 |
| 28 | 316.663803 | 2018-04-29 00:00:27 |
day_with_the_longest_route = daily_lengths[daily_lengths.length == daily_lengths.length.max()]['day']
day_with_the_longest_route
5   2018-04-06 00:00:29
Name: day, dtype: datetime64[ns]
from_day = day_with_the_longest_route.values[0]
to_day = (day_with_the_longest_route+ pd.DateOffset(days=1)).values[0]
truck_trip_longest = truck.reset_index()[(truck.reset_index().timestamp >= from_day) & (truck.reset_index().timestamp < to_day)]
truck_trip_longest = truck_trip_longest.set_index('timestamp').tz_localize(None)
longest_trajectory = mpd.Trajectory(truck_trip_longest,"vehiclesid")
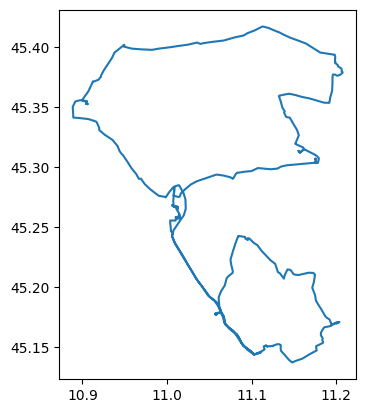
longest_trajectory.to_traj_gdf().plot()
plt.show()
longest_trajectory_plot = longest_trajectory.hvplot(title='Trajectory {}'.format(trajectory.id), line_width=7.0, tiles='CartoLight', color='blue', frame_width=350, frame_height=350)
longest_trajectory_plot
identify the places of the daily departure and arrival points
from geopy.geocoders import ArcGIS
rows = []
geolocator = ArcGIS()
for traj in daily:
    departure = traj.df['geometry'][0]
    latlon = str(departure.y) + "," + str(departure.x);
    location_departure = geolocator.reverse(latlon)
    arrival = traj.df['geometry'][-1]
    latlon = str(arrival.y) + "," + str(arrival.x);
    location_arrival = geolocator.reverse(latlon)
    day = traj.df.reset_index()['timestamp'][0]
    day = day.strftime("%Y-%m-%d")
    data = {}
    data['day'] = day
    data['arrival'] = arrival
    data['arrival_location'] = location_arrival.address
    data['departure'] = departure
    data['departure_location'] = location_arrival.address
    rows.append(data)
arrivals_depatures_days = pd.DataFrame(rows)
arrivals_depatures_days.head(4)
| day | arrival | arrival_location | departure | departure_location | |
|---|---|---|---|---|---|
| 0 | 2018-04-01 | POINT (11.0578 45.17717) | , Nogara, Veneto 37054, ITA | POINT (11.0577683333333 45.1771966666667) | , Nogara, Veneto 37054, ITA |
| 1 | 2018-04-02 | POINT (11.057815 45.177165) | , Nogara, Veneto 37054, ITA | POINT (11.057835 45.1773016666667) | , Nogara, Veneto 37054, ITA |
| 2 | 2018-04-03 | POINT (11.0577966666667 45.177045) | , Nogara, Veneto 37054, ITA | POINT (11.057775 45.1771866666667) | , Nogara, Veneto 37054, ITA |
| 3 | 2018-04-04 | POINT (11.0577333333333 45.17718) | , Nogara, Veneto 37054, ITA | POINT (11.0577733333333 45.1771683333333) | , Nogara, Veneto 37054, ITA |
arrivals_days = arrivals_depatures_days[['day','arrival','arrival_location']]
gdf_locations_arrivals = gpd.GeoDataFrame(arrivals_days,geometry="arrival",crs="epsg:4326")
gdf_locations_arrivals.explore()
depatures_days = arrivals_depatures_days[['day','departure','departure_location']]
gdf_locations_departures = gpd.GeoDataFrame(depatures_days,geometry="departure",crs="epsg:4326")
gdf_locations_departures.explore()
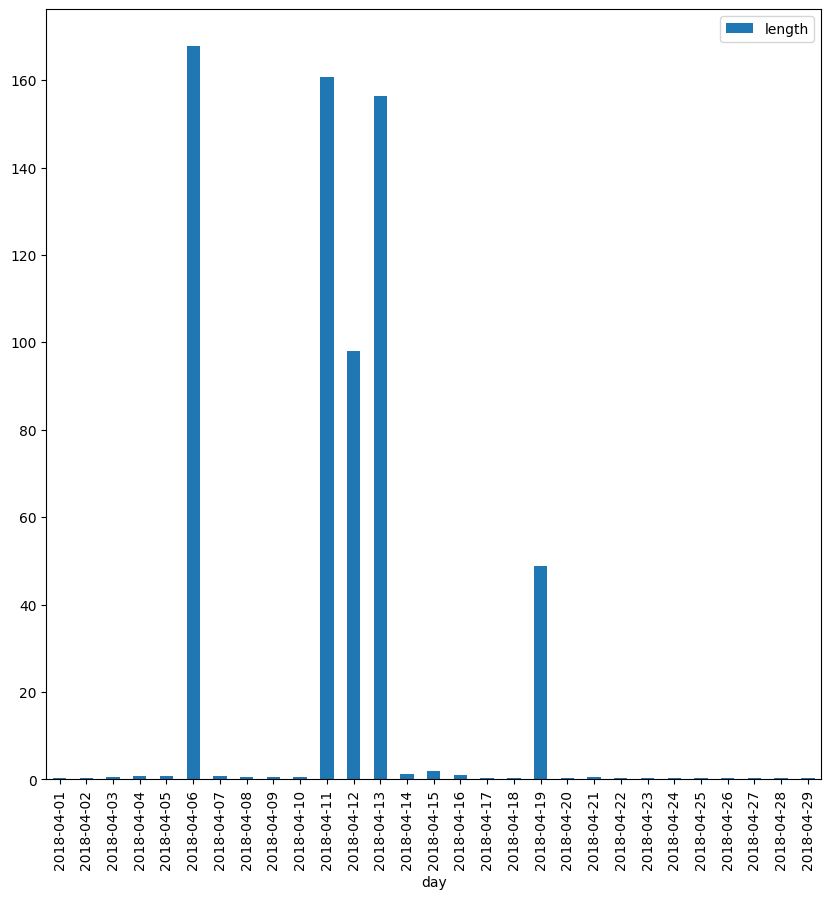
show the km traveled day by day
daily_lengths['length'] = daily_lengths['length'].apply(lambda x: round(x/1000,2))
daily_lengths['day'] = daily_lengths['day'].apply(lambda x: x.strftime("%Y-%m-%d"))
daily_lengths = daily_lengths.set_index("day")
daily_lengths.plot(kind="bar",figsize=(10,10))
plt.show()
identify the breaks carried out in the shortest route of the third week and in the longest one of the last
identify the weeks
from datetime import datetime, timedelta
weeks_begin = truck[truck.weekday == 0].reset_index().sort_values("day")['day'].unique()
weeks_begin
array(['2018-04-02', '2018-04-09', '2018-04-16', '2018-04-23'],
      dtype=object)
first_day_week3 = weeks_begin[2]
first_day_week3
'2018-04-16'
first_day_week4 = weeks_begin[3]
last_day_week3 = datetime.strptime(first_day_week3, "%Y-%m-%d") + timedelta(days=6)
last_day_week4 = datetime.strptime(first_day_week4, "%Y-%m-%d") + timedelta(days=6)
last_day_week3
datetime.datetime(2018, 4, 22, 0, 0)
last_day_week4.strftime("%Y-%m-%d")
'2018-04-29'
shortest route third week
truck_trips_third_week = truck.reset_index()[(truck.reset_index()['timestamp'] >= first_day_week3) & (truck.reset_index()['timestamp'] <= last_day_week3)]
truck_trips_third_week
| timestamp | vehicleid | latitude | longitude | geometry | weekday | weekday_name | day | |
|---|---|---|---|---|---|---|---|---|
| 2304 | 2018-04-16 00:00:30 | 8867 | 45.177327 | 11.058557 | POINT (11.05856 45.17733) | 0 | Monday | 2018-04-16 |
| 2305 | 2018-04-16 00:35:45 | 8867 | 45.177808 | 11.058970 | POINT (11.05897 45.17781) | 0 | Monday | 2018-04-16 |
| 2306 | 2018-04-16 00:42:30 | 8867 | 45.177405 | 11.058687 | POINT (11.05869 45.17741) | 0 | Monday | 2018-04-16 |
| 2307 | 2018-04-16 01:17:44 | 8867 | 45.177460 | 11.058822 | POINT (11.05882 45.17746) | 0 | Monday | 2018-04-16 |
| 2308 | 2018-04-16 02:00:29 | 8867 | 45.177933 | 11.058762 | POINT (11.05876 45.17793) | 0 | Monday | 2018-04-16 |
| ... | ... | ... | ... | ... | ... | ... | ... | ... |
| 2615 | 2018-04-21 19:00:25 | 8867 | 45.176825 | 11.058347 | POINT (11.05835 45.17683) | 5 | Saturday | 2018-04-21 |
| 2616 | 2018-04-21 20:00:29 | 8867 | 45.176722 | 11.058210 | POINT (11.05821 45.17672) | 5 | Saturday | 2018-04-21 |
| 2617 | 2018-04-21 21:00:29 | 8867 | 45.176745 | 11.058333 | POINT (11.05833 45.17674) | 5 | Saturday | 2018-04-21 |
| 2618 | 2018-04-21 22:00:29 | 8867 | 45.176777 | 11.058258 | POINT (11.05826 45.17678) | 5 | Saturday | 2018-04-21 |
| 2619 | 2018-04-21 23:00:29 | 8867 | 45.176928 | 11.058212 | POINT (11.05821 45.17693) | 5 | Saturday | 2018-04-21 |
316 rows × 8 columns
truck_trips_third_week['timestamp'] = pd.to_datetime(truck_trips_third_week['timestamp'], format='%Y-%m-%d %H:%M:%S')
truck_trips_third_week = truck_trips_third_week.set_index("timestamp")
truck_trips_third_week
| vehicleid | latitude | longitude | geometry | weekday | weekday_name | day | |
|---|---|---|---|---|---|---|---|
| timestamp | |||||||
| 2018-04-16 00:00:30 | 8867 | 45.177327 | 11.058557 | POINT (11.05856 45.17733) | 0 | Monday | 2018-04-16 |
| 2018-04-16 00:35:45 | 8867 | 45.177808 | 11.058970 | POINT (11.05897 45.17781) | 0 | Monday | 2018-04-16 |
| 2018-04-16 00:42:30 | 8867 | 45.177405 | 11.058687 | POINT (11.05869 45.17741) | 0 | Monday | 2018-04-16 |
| 2018-04-16 01:17:44 | 8867 | 45.177460 | 11.058822 | POINT (11.05882 45.17746) | 0 | Monday | 2018-04-16 |
| 2018-04-16 02:00:29 | 8867 | 45.177933 | 11.058762 | POINT (11.05876 45.17793) | 0 | Monday | 2018-04-16 |
| ... | ... | ... | ... | ... | ... | ... | ... |
| 2018-04-21 19:00:25 | 8867 | 45.176825 | 11.058347 | POINT (11.05835 45.17683) | 5 | Saturday | 2018-04-21 |
| 2018-04-21 20:00:29 | 8867 | 45.176722 | 11.058210 | POINT (11.05821 45.17672) | 5 | Saturday | 2018-04-21 |
| 2018-04-21 21:00:29 | 8867 | 45.176745 | 11.058333 | POINT (11.05833 45.17674) | 5 | Saturday | 2018-04-21 |
| 2018-04-21 22:00:29 | 8867 | 45.176777 | 11.058258 | POINT (11.05826 45.17678) | 5 | Saturday | 2018-04-21 |
| 2018-04-21 23:00:29 | 8867 | 45.176928 | 11.058212 | POINT (11.05821 45.17693) | 5 | Saturday | 2018-04-21 |
316 rows × 7 columns
# this trajectory contains all the points of the truck
trajectory_third_week = mpd.Trajectory(truck_trips_third_week,"vehiclesid")
traj_collection_third_week = mpd.TrajectoryCollection(trajectory_third_week.to_point_gdf(), 'vehicleid',"timestamp¨")
traj_collection_third_week
TrajectoryCollection with 1 trajectories
daily_third_week = mpd.TemporalSplitter(traj_collection_third_week).split(mode='day')
daily_lengths_third_week = [traj.get_length() for traj in daily_third_week]
min_lenght = min(daily_lengths_third_week)
idx_min_length = daily_lengths_third_week.index(min_lenght)
daily_days_third_week = [traj.get_start_time() for traj in daily_third_week]
daily_days_third_week
[datetime.datetime(2018, 4, 16, 0, 0, 30),
 datetime.datetime(2018, 4, 17, 0, 0, 29),
 datetime.datetime(2018, 4, 18, 0, 0, 29),
 datetime.datetime(2018, 4, 19, 0, 0, 29),
 datetime.datetime(2018, 4, 20, 0, 0, 30),
 datetime.datetime(2018, 4, 21, 0, 0, 29)]
day_shortest_route_third_week = daily_days_third_week[idx_min_length]
day_shortest = day_shortest_route_third_week.strftime("%Y-%m-%d")
print("the route of the %s is long %f km" % (day_shortest,round((min_lenght/1000),2)))
the route of the 2018-04-20 is long 0.320000 km
stops_third_week = mpd.TrajectoryStopDetector(trajectory_third_week)
seconds_pause = 120
max_diameter = min_lenght
stop_durations_third_week = stops_third_week.get_stop_time_ranges(min_duration=timedelta(seconds=seconds_pause), max_diameter=max_diameter)
stops_trajections = []
for stop_time in stop_durations_third_week:
    time_stop = stop_time.t_0
    day_stop = time_stop.strftime("%Y-%m-%d")
    if day_stop == day_shortest:
       stops_trajections.append(stop_time)
for stops_trajection in stops_trajections:
    print(stops_trajection)
print("there are %i trajectory with breaks of %s seconds in the range of %i diameter" % (len(stops_trajections),seconds_pause,max_diameter))
there are 0 trajectory with breaks of 120 seconds in the range of 324 diameter
stop_points_third_week = stops_third_week.get_stop_points(min_duration=timedelta(seconds=seconds_pause), max_diameter=max_diameter)
stop_points_third_week
| geometry | start_time | end_time | traj_id | duration_s | |
|---|---|---|---|---|---|
| stop_id | |||||
| vehiclesid_2018-04-16 00:00:30 | POINT (11.05856 45.17733) | 2018-04-16 00:00:30 | 2018-04-19 07:34:16 | vehiclesid | 286426.0 |
| vehiclesid_2018-04-19 07:39:47 | POINT (11.04663 45.19661) | 2018-04-19 07:39:47 | 2018-04-19 07:46:18 | vehiclesid | 391.0 |
| vehiclesid_2018-04-19 08:12:09 | POINT (11.22977 45.15575) | 2018-04-19 08:12:09 | 2018-04-19 08:24:27 | vehiclesid | 738.0 |
| vehiclesid_2018-04-19 08:31:59 | POINT (11.25244 45.11512) | 2018-04-19 08:31:59 | 2018-04-19 08:44:12 | vehiclesid | 733.0 |
| vehiclesid_2018-04-19 09:15:11 | POINT (11.05724 45.17798) | 2018-04-19 09:15:11 | 2018-04-21 23:00:29 | vehiclesid | 222318.0 |
breaks of longest route one the last week
truck_trips_last_week = truck.reset_index()[(truck.reset_index()['timestamp'] >= first_day_week4) & (truck.reset_index()['timestamp'] <= last_day_week4)]
truck_trips_last_week['timestamp'] = pd.to_datetime(truck_trips_last_week['timestamp'], format='%Y-%m-%d %H:%M:%S')
truck_trips_last_week = truck_trips_last_week.set_index("timestamp")
trajectory_last_week = mpd.Trajectory(truck_trips_last_week,"vehiclesid")
traj_collection_last_week = mpd.TrajectoryCollection(trajectory_last_week.to_point_gdf(), 'vehicleid',"timestamp¨")
daily_last_week = mpd.TemporalSplitter(traj_collection_last_week).split(mode='day')
daily_lengths_last_week = [traj.get_length() for traj in daily_last_week]
max_lenght = max(daily_lengths_last_week)
idx_max_lenght = daily_lengths_last_week.index(max_lenght)
daily_days_last_week = [traj.get_start_time() for traj in daily_last_week]
day_longest_route_last_week = daily_days_last_week[idx_max_lenght]
day_longest = day_longest_route_last_week.strftime("%Y-%m-%d")
print("the route of the %s is long %f km" % (day_longest,round((max_lenght/1000),2)))
the route of the 2018-04-28 is long 0.340000 km
stops_last_week = mpd.TrajectoryStopDetector(trajectory_last_week)
seconds_pause = 60
max_diameter = 30
stop_durations_last_week = stops_last_week.get_stop_time_ranges(min_duration=timedelta(seconds=seconds_pause), max_diameter=max_diameter)
stops_trajections = []
for stop_time in stop_durations_last_week:
    time_stop = stop_time.t_0
    day_stop = time_stop.strftime("%Y-%m-%d")
    if day_stop == day_longest:
       stops_trajections.append(stop_time)
stops_trajections
[<movingpandas.time_range_utils.TemporalRangeWithTrajId at 0x7f7e7c3c0580>,
 <movingpandas.time_range_utils.TemporalRangeWithTrajId at 0x7f7e7ec695d0>]
stop_points = stops_last_week.get_stop_points(min_duration=timedelta(seconds=seconds_pause), max_diameter=max_diameter)
traj_plot = trajectory_last_week.hvplot(title='Trajectory {}'.format(trajectory_last_week.obj_id), line_width=7.0, tiles='CartoLight', color='slategray', frame_width=350, frame_height=350)
stop_point_plot = traj_plot * stop_points.hvplot(geo=True, color='deeppink')
stop_point_plot
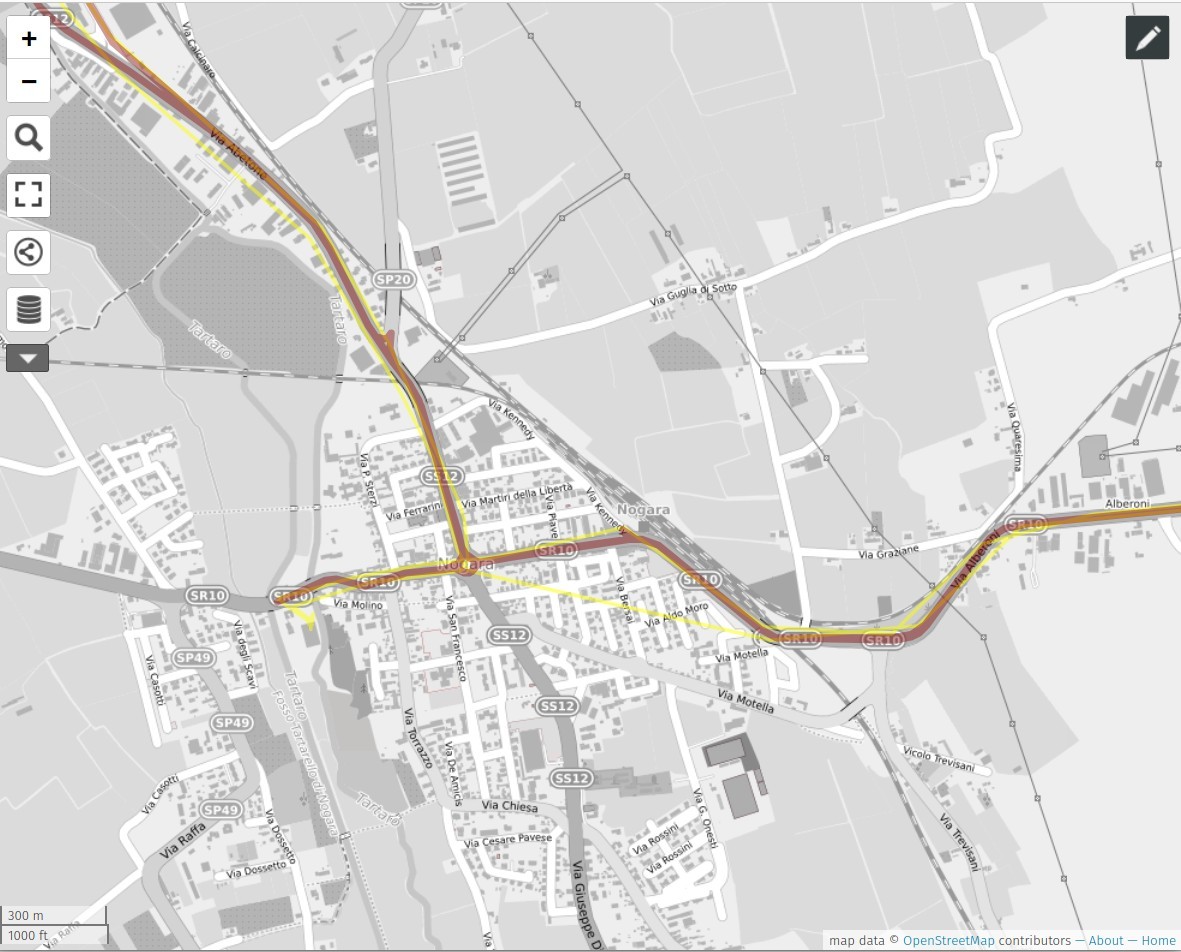
identify the longest route of the third week of the month on the OpenStreetMap road graph
for this operation we will use an algorithm of Map Matching.
Map matching is the problem of how to match recorded geographic coordinates to a logical model of the real world,

Read the article Fast map matching, an algorithm integrating hidden Markov model with precomputation
The method use is Map-matching for low-sampling-rate GPS trajectories
Read the documentation for the installation
download of the OSM data
Nogara is locate in Province of Verona - download the OSM raw data from https://osmit-estratti.wmcloud.org
url_download_verona_province_pbf = 'https://osmit-estratti.wmcloud.org/dati/poly/province/pbf/023_Verona_poly.osm.pbf'
pbf_filename = "verona_province_osm.pbf"
import urllib.request
urllib.request.urlretrieve(url_download_verona_province_pbf ,pbf_filename)
('verona_province_osm.pbf', <http.client.HTTPMessage at 0x7f7e7ed62080>)
setup the network for FMM
by using OSMnx
truck.geometry.unary_union.convex_hull.buffer(0.002)

# Initiliaze with bounding box
osm = pyrosm.OSM(pbf_filename,bounding_box=truck.geometry.unary_union.convex_hull)
# creation of the graph
nodes, edges = osm.get_network(network_type="driving", nodes=True)
G = osm.to_graph(nodes, edges, graph_type="networkx")
%time
CPU times: user 4 µs, sys: 0 ns, total: 4 µs
Wall time: 6.68 µs
# archive edges and nodes in ESRI Shapefile (required of FMM)
encoding="utf-8"
filepath_nodes = "nodes.shp"
filepath_edges = "edges.shp"
gdf_nodes, gdf_edges = ox.utils_graph.graph_to_gdfs(G)
# convert undirected graph to gdfs and stringify non-numeric columns
gdf_nodes = ox.io._stringify_nonnumeric_cols(gdf_nodes)
gdf_edges = ox.io._stringify_nonnumeric_cols(gdf_edges)
%time
CPU times: user 4 µs, sys: 0 ns, total: 4 µs
Wall time: 7.39 µs
# We need an unique ID for each edge
gdf_edges["fid"] = np.arange(0, gdf_edges.shape[0], dtype='int')
# save the nodes and edges as separate ESRI shapefiles
del gdf_nodes['osmid']
gdf_nodes.to_file(filepath_nodes, encoding=encoding)
gdf_edges.to_file(filepath_edges, encoding=encoding)
%time
CPU times: user 3 µs, sys: 0 ns, total: 3 µs
Wall time: 5.96 µs
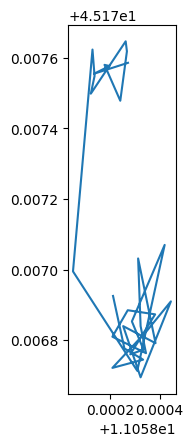
identify the longest route of the third week of the month
gdf_traj = None
max_length = -1
for traj in daily_third_week:
    gdf_tmp = traj.to_traj_gdf()
    if (gdf_tmp.length.values[0] >= max_length):
        gdf_traj = gdf_tmp
        max_length = gdf_tmp.length.values[0]
gdf_tmp.length.values[0]
0.0048786027370615135
gdf_tmp.plot()
<AxesSubplot:>
route_wkt = gdf_traj.geometry.values[0].wkt
route_wkt
'LINESTRING (11.0582183333333 45.1776066666667, 11.0580666666667 45.1775733333333, 11.0582116666667 45.1775266666667, 11.05807 45.1775566666667, 11.0581116666667 45.1775383333333, 11.0582633333333 45.1776016666667, 11.0582133333333 45.17757, 11.058125 45.1774583333333, 11.0582266666667 45.1775533333333, 11.05753 45.17791, 11.0602783333333 45.1785383333333, 11.0619766666667 45.178685, 11.0635383333333 45.1788316666667, 11.0638083333333 45.1791133333333, 11.0636533333333 45.1801283333333, 11.0634616666667 45.1805933333333, 11.0609683333333 45.1845466666667, 11.0585616666667 45.1874683333333, 11.051 45.19233, 11.046855 45.1966366666667, 11.0466266666667 45.1966066666667, 11.0466133333333 45.1966416666667, 11.0466133333333 45.1966433333333, 11.0466133333333 45.1966433333333, 11.045855 45.19633, 11.0463416666667 45.19559, 11.05125 45.1914116666667, 11.0581266666667 45.187205, 11.061395 45.1833216666667, 11.0625416666667 45.1816716666667, 11.0634183333333 45.1793666666667, 11.063785 45.1788266666667, 11.0745866666667 45.1770716666667, 11.0798683333333 45.17744, 11.083575 45.1799383333333, 11.10339 45.1813166666667, 11.13233 45.1831433333333, 11.1503933333333 45.18447, 11.150765 45.1842866666667, 11.1523433333333 45.18063, 11.1529633333333 45.1788766666667, 11.1542133333333 45.1758883333333, 11.1544033333333 45.1758166666667, 11.1858316666667 45.1827366666667, 11.1907666666667 45.183775, 11.191015 45.18354, 11.1938516666667 45.1787733333333, 11.1985966666667 45.1710383333333, 11.2019066666667 45.1685933333333, 11.2065883333333 45.1662566666667, 11.2102283333333 45.16288, 11.2156083333333 45.15894, 11.2195966666667 45.1564883333333, 11.2263133333333 45.1566216666667, 11.2294366666667 45.155525, 11.2299166666667 45.1556966666667, 11.2297683333333 45.1557483333333, 11.2298366666667 45.1557816666667, 11.2294283333333 45.1556583333333, 11.229695 45.1508833333333, 11.230265 45.1445083333333, 11.231235 45.138115, 11.231355 45.1335583333333, 11.23233 45.1331066666667, 11.23574 45.1299133333333, 11.2454816666667 45.1229916666667, 11.2495516666667 45.1198433333333, 11.2537233333333 45.1166183333333, 11.2524366666667 45.115115, 11.2527416666667 45.1145233333333, 11.25298 45.1140633333333, 11.2527433333333 45.1140733333333, 11.2533233333333 45.114705, 11.2531266666667 45.1148283333333, 11.2525383333333 45.1153433333333, 11.2537483333333 45.11685, 11.2501216666667 45.119545, 11.2455366666667 45.1228833333333, 11.236565 45.1292966666667, 11.232995 45.1319633333333, 11.2323416666667 45.1332433333333, 11.2314566666667 45.1335683333333, 11.2313883333333 45.138195, 11.23046 45.1441516666667, 11.2298716666667 45.1506383333333, 11.22945 45.1560816666667, 11.2292383333333 45.15616, 11.2219733333333 45.156995, 11.21815 45.15739, 11.2128 45.1608816666667, 11.2088616666667 45.165035, 11.2033616666667 45.168345, 11.1999033333333 45.1704483333333, 11.19747 45.1726316666667, 11.1950083333333 45.17772, 11.19175 45.18283, 11.19123 45.1840983333333, 11.1909966666667 45.1841266666667, 11.18436 45.18258, 11.1794366666667 45.18126, 11.1761466666667 45.1806316666667, 11.167415 45.1787283333333, 11.1588283333333 45.1768333333333, 11.154265 45.176185, 11.15378 45.1772483333333, 11.1522783333333 45.1816533333333, 11.1513 45.183925, 11.15121 45.1842616666667, 11.1454466666667 45.184275, 11.1439083333333 45.1842283333333, 11.1354583333333 45.1835383333333, 11.1254583333333 45.1827416666667, 11.1154533333333 45.1818316666667, 11.1055983333333 45.181555, 11.0957966666667 45.1809266666667, 11.0861416666667 45.1802633333333, 11.082165 45.17951, 11.0789533333333 45.1772383333333, 11.0743966666667 45.1774166666667, 11.0693716666667 45.1799166666667, 11.0647 45.1791516666667, 11.0621666666667 45.1789816666667, 11.05965 45.17866, 11.0570033333333 45.1781366666667, 11.05724 45.1779766666667, 11.0581566666667 45.177515, 11.0580933333333 45.177495, 11.058195 45.177525, 11.0581516666667 45.1775216666667, 11.0582083333333 45.1775316666667, 11.0581566666667 45.1775383333333, 11.0581466666667 45.1775583333333, 11.05813 45.17756, 11.05821 45.1775016666667, 11.0581433333333 45.17746, 11.0581516666667 45.1773466666667, 11.05816 45.1775316666667, 11.0581666666667 45.1775633333333, 11.0581966666667 45.177475, 11.05815 45.177495, 11.0581366666667 45.1775216666667, 11.05827 45.17774, 11.0581933333333 45.17755, 11.0580833333333 45.1775683333333, 11.0582033333333 45.1775933333333, 11.0581333333333 45.1775516666667, 11.0581183333333 45.1775316666667)'
execute the map matching
from fmm import Network,NetworkGraph,STMATCH,STMATCHConfig
import urllib
### Read network data
# uncomment the lines
# from here ...

# url_edges_verona = 'https://github.com/napo/geospatial_course_unitn/raw/master/data/geotemporaldata/network_verona_province/edges.zip'
# out_filename = "edges.zip"
# urllib.request.urlretrieve(url_edges_verona ,out_filename)
# import shutil
# shutil.unpack_archive(out_filename, ".")

# ... to here
# if you want to download the data from internet otherwise use the data created in the previous step

network = Network("edges.shp","fid","u","v")
graph = NetworkGraph(network)
[2022-11-21 12:33:58.810] [info] [network.cpp:72] Read network from file edges.shp
[2022-11-21 12:33:59.519] [info] [network.cpp:170] Number of edges 104873 nodes 55140
[2022-11-21 12:33:59.519] [info] [network.cpp:171] Field index: id 37 source 0 target 1
[2022-11-21 12:33:59.575] [info] [network.cpp:174] Read network done.
[2022-11-21 12:33:59.576] [info] [network_graph.cpp:17] Construct graph from network edges start
[2022-11-21 12:33:59.583] [info] [network_graph.cpp:30] Graph nodes 55140 edges 104873
[2022-11-21 12:33:59.583] [info] [network_graph.cpp:31] Construct graph from network edges end
apply the STMatch algorythm
model = STMATCH(network,graph)
More info about the parameters are here
k = 1 #	number of candidates
gps_error = 0.0005 #GPS error, unit is map_unit.
radius = 0.003 #search radius for candidates, unit is map_unit
vmax = 30 #maximum speed of the vehicle, unit is map_unit/second
stmatch_config = STMATCHConfig(k, radius, gps_error, vmax)
result = model.match_wkt(route_wkt,stmatch_config)
matched_path = list(result.cpath)
matched_edge_for_each_point = list(result.opath)
matched_edge_index = list(result.indices)
linestring_wkt = result.mgeom.export_wkt()
point_wkt = result.pgeom.export_wkt()
wkt.loads(linestring_wkt)

wkt.loads(route_wkt)

from geojson import dump
geometry_matched = geojson.Feature(geometry=wkt.loads(linestring_wkt), properties={})
with open('geometry_matched.geojson', 'w') as f:
   dump(geometry_matched, f)
geometry_original = geojson.Feature(geometry=wkt.loads(route_wkt), properties={})
with open('geometry_original.geojson', 'w') as f:
   dump(geometry_original, f)
you can download the files geometry_matched.geojson and geometry_original.geojson
or simple compare here