Solution 07
Setup
import warnings
warnings.simplefilter("ignore")
try:
  import geopandas as gpd
except ModuleNotFoundError as e:
  !pip install geopandas==0.12.1
  import geopandas as gpd

if gpd.__version__ != "0.12.1":
  !pip install -U geopandas==0.12.1
  import geopandas as gpd
try:
  import rasterio as rio
except ModuleNotFoundError as e:
  !pip install rasterio==1.3.4
  import rasterio as rio

if rio.__version__ != "1.3.4":
  !pip install -U rasterio==1.3.4
  import rasterio as rio
try:
  import xarray as xr
except ModuleNotFoundError as e:
  !pip install xarray-spatial==0.3.5
  import xarray as xr

if xr.__version__ != "0.3.5":
  !pip install -U xarray-spatial==0.3.5
  import xarray as xr
try:
  import rtxpy
except ModuleNotFoundError as e:
  !pip install rtxpy==0.0.3
  import rtxpy
try:
    import spatialpandas
except ModuleNotFoundError as e:
    !pip install spatialpandas==0.4.4
    import spatialpandas

if spatialpandas.__version__ != "0.4.4":
    !pip install -U spatialpandas==0.4.4
    import spatialpandas
try:
    import numba
except ModuleNotFoundError as e:
    !pip install numba==0.56.4
    import numba

if numba.__version__ != "0.56.4":
    !pip install -U numba==0.56.4
    import numba
try:
  import owslib
except ModuleNotFoundError as e:
  !pip install owslib==0.27.2
  import owslib
from matplotlib import pyplot as plt
Exercises
- clip the area with the shape of Polo Ferrari (in front on FBK)
- create the altitude profile of the street “Via Sommarive”
- find the area FBK in the WMS of municipality of Trento - layer “Carta Tecnica 1:2.000 alta risoluzione” and vectorize it
-
identify what is possibile to see from the crossing point between Via Sommarive and Via dei Valoni
clip the area with the shape of Polo Ferrari (in front on FBK)
- identify the area of Polo Ferrari
- download the raster of scientific hub in Povo
- clip area
import geopandas as gpd
import rasterio
from rasterio.mask import mask
from rasterio.plot import show
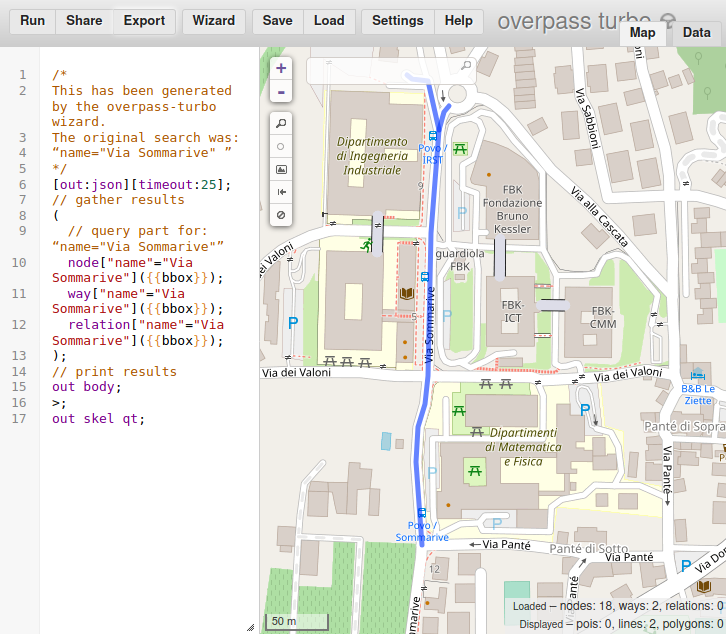
1. identify the area of Polo Ferrari

http://overpass-turbo.eu/s/ZzP
geojson_polo_ferarri = "https://raw.githubusercontent.com/napo/geospatial_course_unitn/master/data/openstreetmap/polo_ferrari_boundary.geojson"
polo_ferrari = gpd.read_file(geojson_polo_ferarri)
polo_ferrari.plot()
plt.show()
polo_ferrari.geometry.type.unique()
array(['LineString'], dtype=object)
polo_ferrari.geometry.unary_union.envelope

area_polo_ferrari = polo_ferrari.geometry.unary_union.envelope
type(area_polo_ferrari)
shapely.geometry.polygon.Polygon
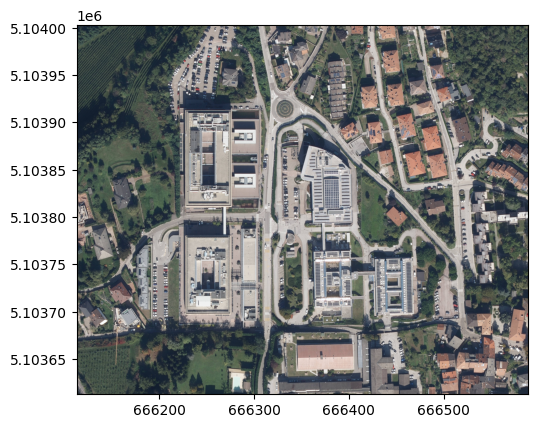
2. download the raster of scientific hub in Povo
url_download_orthophoto_scientific_hub_povo = 'https://github.com/napo/geospatial_course_unitn/raw/master/data/raster/trento_scientifc_hub_povo.tif'
raster = rasterio.open(url_download_orthophoto_scientific_hub_povo)
show(raster)
<AxesSubplot:>
raster.meta
{'driver': 'GTiff',
 'dtype': 'uint8',
 'nodata': None,
 'width': 4761,
 'height': 3900,
 'count': 3,
 'crs': CRS.from_epsg(25832),
 'transform': Affine(0.09999999999999999, 0.0, 666113.0,
        0.0, -0.09999999999999999, 5104003.0)}
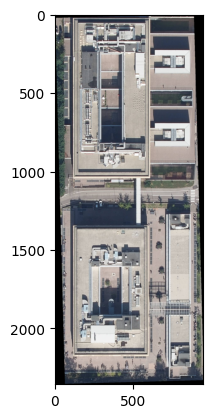
3. clip area
def getFeatures(gdf):
    """Function to parse features from GeoDataFrame in such a manner that rasterio wants them"""
    import json
    return [json.loads(gdf.to_json())['features'][0]['geometry']]
gdf_polo_ferrari_25832 = gpd.GeoSeries([area_polo_ferrari]).set_crs("EPSG:4326").to_crs("EPSG:25832")
coords = getFeatures(gdf_polo_ferrari_25832)
coords
[{'type': 'Polygon',
  'coordinates': [[[666221.9300357221, 5103679.093307299],
    [666310.1180686228, 5103681.477369573],
    [666303.8138183787, 5103914.6097356975],
    [666215.6291314249, 5103912.225679764],
    [666221.9300357221, 5103679.093307299]]]}]
raster_polo_ferrari, raster_polo_ferrari_transform = mask(raster, coords, crop=True)
show(raster_polo_ferrari)
<AxesSubplot:>
raster_polo_ferrari_meta = raster.meta
raster_polo_ferrari_meta.update({"driver": "GTiff",
                 "height": raster_polo_ferrari.shape[1],
                 "width": raster_polo_ferrari.shape[2],
                 "transform": raster_polo_ferrari_transform})

with rasterio.open("polo_ferrari_orthophoto.tif", "w", **raster_polo_ferrari_meta) as dest:
    dest.write(raster_polo_ferrari)
#uncomment if you want download with colab
#from google.colab import files
#files.download('polo_ferrari_orthophoto.tif')
create the altitude profile of the street “Via Sommarive”
- download the street “Via Sommarive” from OpenStreetMap
- download the DTM file of the scientific hub of Povo
- clip the street inside the area covered of the DTM
- extract the points of the street
- extract the altitude value for each points
-
show the altitude
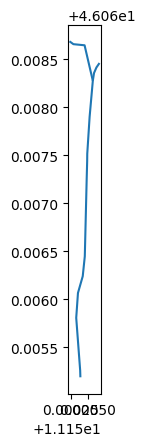
1. download the street “Via Sommarive” from OpenStreetMap
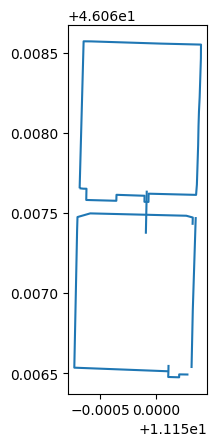
via_sommarive = gpd.read_file("https://raw.githubusercontent.com/napo/geospatial_course_unitn/master/data/openstreetmap/via_sommarive.geojson")
via_sommarive.plot()
plt.show()
2. download the DTM file of the scientific hub of Povo
import urllib.request
url_download_dtm_scientific_hub_povo = 'https://github.com/napo/geospatial_course_unitn/raw/master/data/raster/trento_scientifc_hub_povo_dtm.asc'
dtm = "trento_scientifc_hub_povo_dtm.asc"
urllib.request.urlretrieve(url_download_dtm_scientific_hub_povo ,dtm)
url_download_dtm_scientific_hub_povo_prj = 'https://github.com/napo/geospatial_course_unitn/raw/master/data/raster/trento_scientifc_hub_povo_dtm.prj'
dtm_prj = "trento_scientifc_hub_povo_dtm.prj"
urllib.request.urlretrieve(url_download_dtm_scientific_hub_povo_prj ,dtm_prj)
('trento_scientifc_hub_povo_dtm.prj',
 <http.client.HTTPMessage at 0x7f99f94bfca0>)
dtm = "trento_scientifc_hub_povo_dtm.asc"
raster_dtm = rasterio.open(dtm)
show(raster_dtm, cmap='Greys')
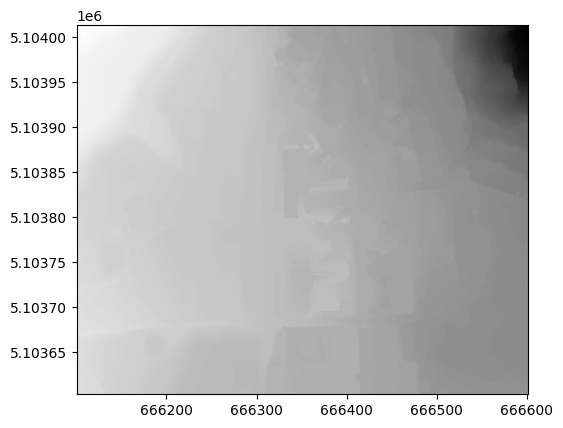
<AxesSubplot:>
3. clip the street inside the area covered of the DTM
raster_dtm.bounds
BoundingBox(left=666100.6735466761, bottom=5103603.23583161, right=666600.6735466761, top=5104013.23583161)
minx = raster_dtm.bounds.left
maxx = raster_dtm.bounds.right
miny = raster_dtm.bounds.bottom
maxy = raster_dtm.bounds.top
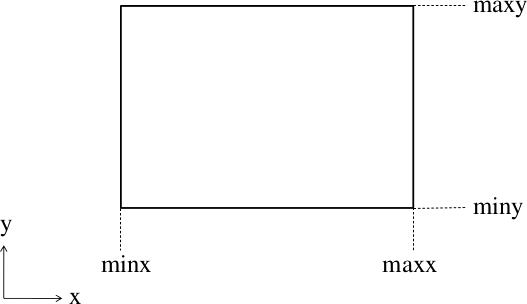
from shapely.geometry import Polygon
bbox_raster_dtm = Polygon([[minx, miny], [maxx, miny], [maxx, maxy], [minx, maxy]])
geoseries_bbox_raster_dtm = gpd.GeoSeries([bbox_raster_dtm]).set_crs("EPSG:25832").to_crs("EPSG:4326")
geoseries_bbox_raster_dtm
0    POLYGON ((11.14767 46.06582, 11.15413 46.06570...
dtype: geometry
gdf_bbox_raster_dtm = gpd.GeoDataFrame(geometry=geoseries_bbox_raster_dtm)
gdf_bbox_raster_dtm
| geometry | |
|---|---|
| 0 | POLYGON ((11.14767 46.06582, 11.15413 46.06570... |
sommarive_street_inside_dtm = gpd.overlay(via_sommarive, gdf_bbox_raster_dtm, how='intersection')
sommarive_street_inside_dtm
| id | @id | highway | lit | maxspeed | maxspeed:type | name | source:maxspeed | surface | geometry | |
|---|---|---|---|---|---|---|---|---|---|---|
| 0 | way/97004470 | way/97004470 | unclassified | yes | None | IT:urban | Via Sommarive | None | asphalt | LINESTRING (11.15033 46.06577, 11.15033 46.065... |
| 1 | way/382958545 | way/382958545 | residential | None | 50 | None | Via Sommarive | sign | asphalt | LINESTRING (11.15058 46.06828, 11.15045 46.068... |
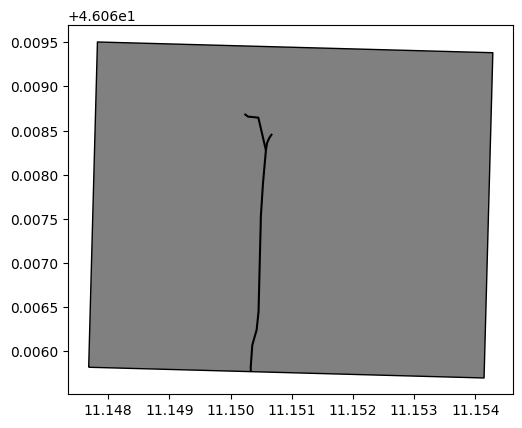
fig, ax = plt.subplots()
sommarive_street_inside_dtm.plot(ax=ax, color='black', edgecolor='black')
gdf_bbox_raster_dtm.plot(ax=ax, color='gray', edgecolor='black')
plt.show();
sommarive_street_inside_dtm.highway
0    unclassified
1     residential
Name: highway, dtype: object
sommarive_street_inside_dtm[sommarive_street_inside_dtm.highway == 'unclassified'].plot()
plt.show()
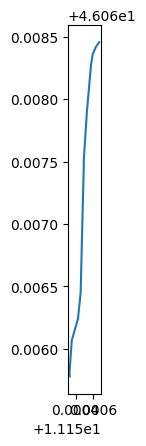
sommarive_street_inside_dtm[sommarive_street_inside_dtm.highway == 'unclassified'].geometry.values[0]

linestring_sommarive_street = sommarive_street_inside_dtm[sommarive_street_inside_dtm.highway == 'unclassified'].geometry.values[0]
4. extract the points of the street
we need to convert the points from WGS84 to ETRS89
import shapely
import pyproj
from shapely.ops import transform
wgs84 = pyproj.CRS('EPSG:4326')
crs_dtm = pyproj.CRS('EPSG:25832')
projection_transform = pyproj.Transformer.from_crs(wgs84, crs_dtm, always_xy=False).transform
def convert(x,y):
  p = shapely.geometry.Point(y,x)
  p = transform(projection_transform,p)
  return(p)
pointsx = []
pointsy = []
for coordinate in linestring_sommarive_street.coords:
  x = coordinate[0]
  y = coordinate[1]
  point = convert(x,y)
  pointsx.append(point.x)
  pointsy.append(point.y)
pointsx[0]
666306.4552006973
pointsy[0]
5103603.230911811
4. extract the altitude value for each points
import pandas as pd
#calculate the distance point-to-point
from shapely.geometry import Point,LineString
lengths = []
previousPoint = None
length = 0
for i in range(len(pointsx)):
  point = shapely.geometry.Point(pointsy[i],pointsx[i])
  if previousPoint is None:
    lengths.append(length)
  else:
    length = LineString([previousPoint,point]).length + length
    lengths.append(length)
  previousPoint = point
lengths
[0,
 3.951209708453172,
 32.831459095104734,
 52.980608611161294,
 76.08957728511274,
 92.85559295820157,
 165.21088895086632,
 186.20305604139205,
 194.89525292991763,
 237.73013209200536,
 279.6642269476137,
 288.7776897544056,
 295.68268594259496,
 301.98476544905714]
raster_dtm.count
1
data = raster_dtm.read(1)
data
array([[335., 335., 335., ..., 468., 469., 469.],
       [334., 334., 334., ..., 469., 469., 469.],
       [334., 334., 334., ..., 469., 469., 469.],
       ...,
       [357., 357., 357., ..., 400., 400., 401.],
       [356., 357., 357., ..., 400., 400., 400.],
       [356., 357., 357., ..., 400., 400., 400.]], dtype=float32)
rows,cols = rasterio.transform.rowcol(raster_dtm.transform,(pointsx),(pointsy))
values = []
for i in range(len(rows)):
  values.append(data[rows[i]-1][cols[i]-1])
values
[382.0,
 382.0,
 380.0,
 378.0,
 378.0,
 378.0,
 378.0,
 378.0,
 378.0,
 378.0,
 380.0,
 380.0,
 381.0,
 381.0]
sommarive_street_3d = pd.DataFrame()
sommarive_street_3d['value'] = values
sommarive_street_3d['length'] = lengths
sommarive_street_3d
| value | length | |
|---|---|---|
| 0 | 382.0 | 0.000000 |
| 1 | 382.0 | 3.951210 |
| 2 | 380.0 | 32.831459 |
| 3 | 378.0 | 52.980609 |
| 4 | 378.0 | 76.089577 |
| 5 | 378.0 | 92.855593 |
| 6 | 378.0 | 165.210889 |
| 7 | 378.0 | 186.203056 |
| 8 | 378.0 | 194.895253 |
| 9 | 378.0 | 237.730132 |
| 10 | 380.0 | 279.664227 |
| 11 | 380.0 | 288.777690 |
| 12 | 381.0 | 295.682686 |
| 13 | 381.0 | 301.984765 |
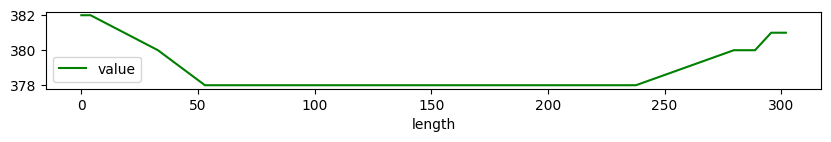
ax = sommarive_street_3d.plot(y='value',x="length",color='green',figsize=(10,1))
plt.show()
find the area FBK in the WMS of municipality of Trento - layer “Carta Tecnica 1:2.000 alta risoluzione” and vectorize it
- create a bounding box based on the FBK area in Povo
- load the WMS of muncipality of Trento as rasterio on the size of the bounding box
-
vectorize the rasterio
1. create a bounding box based on the FBK area in Povo
.. we can use the same geojson extracted from OSM used on the lesson
fbk = gpd.read_file("https://raw.githubusercontent.com/napo/geospatial_course_unitn/master/data/openstreetmap/boundary_fbk_povo.geojson")
bbox = fbk.geometry[0].bounds
bbox
(11.1505197, 46.0664359, 11.1530713, 46.0684635)
fbk.shape
(1, 10)
2. load the WMS of muncipality of Trento as rasterio on the size of the bounding box
from owslib.wms import WebMapService
import rasterio.crs
wms_trento = "http://webapps.comune.trento.it/ogc"
wms = WebMapService(wms_trento)
title="Carta Tecnica 1:2.000 alta risoluzione a colori"
for content in wms.contents:
  layer = wms[content]
  if layer.title == title:
    break
content
'ct2000_colori'
layer.crsOptions
['EPSG:3857', 'EPSG:25832', 'EPSG:4326']
request = wms.getmap(
    layers=[content],
    srs='EPSG:4326',
    format='image/tiff',
    bbox=bbox,
    size=(1024,800)
    )
from rasterio import MemoryFile
from rasterio.plot import show
from rasterio import features
wms_image = MemoryFile(request).open()
wms_image.profile
{'driver': 'GTiff', 'dtype': 'uint8', 'nodata': None, 'width': 1024, 'height': 800, 'count': 3, 'crs': CRS.from_epsg(4326), 'transform': Affine(2.4917968750015575e-06, 0.0, 11.1505197,
       0.0, -2.5344999999997646e-06, 46.0684635), 'blockysize': 2, 'tiled': False, 'interleave': 'pixel'}
show(wms_image)
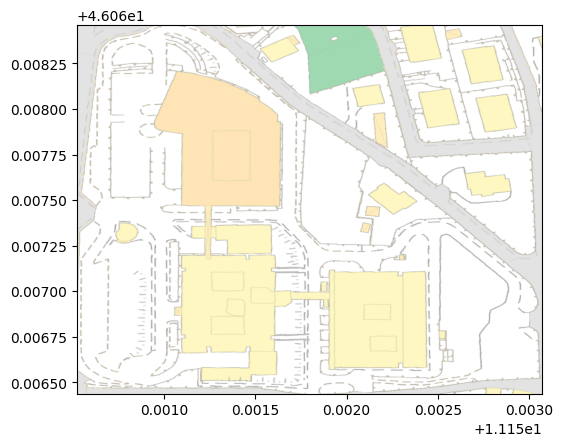
<AxesSubplot:>
wms_image.count
3
show((wms_image, 1), cmap='Reds')
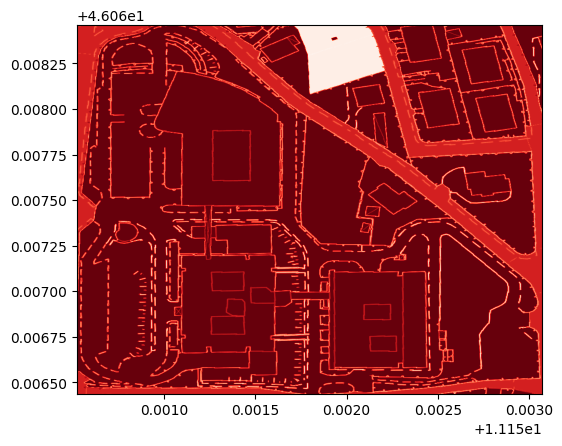
<AxesSubplot:>
show((wms_image, 2), cmap='Greens')
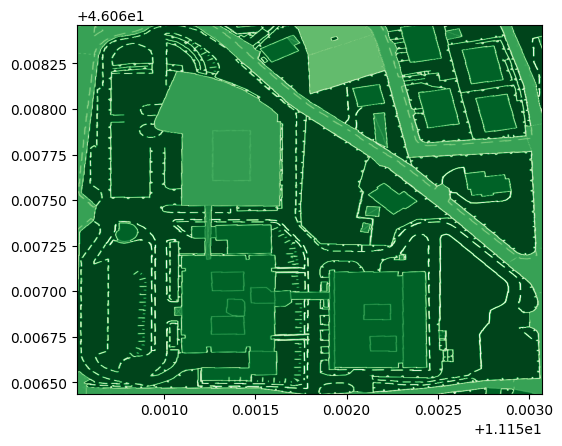
<AxesSubplot:>
show((wms_image, 3), cmap='Blues')
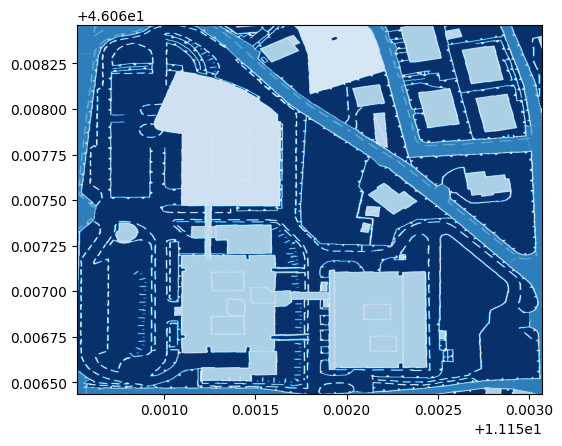
<AxesSubplot:>
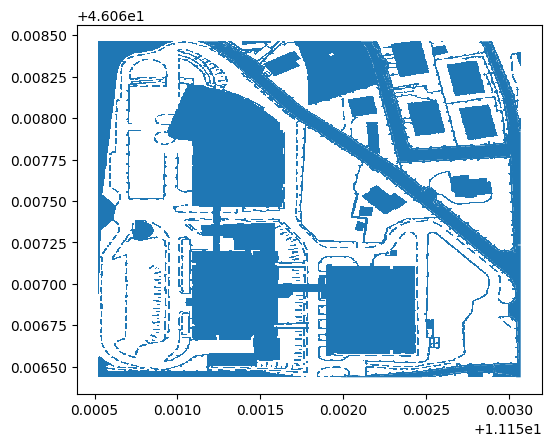
from rasterio.features import shapes
image = wms_image.read(3) # first band
mask = image != 255
results = (
  {'properties': {'raster_val': v}, 'geometry': s}
  for i, (s, v)
    in enumerate(
      shapes(image, mask=mask, transform=wms_image.transform)))
geoms = list(results)
fbk_area_vector = gpd.GeoDataFrame.from_features(geoms)
fbk_area_vector.shape
(78339, 2)
fbk_area_vector.plot()
plt.show()
%time
CPU times: user 4 µs, sys: 1 µs, total: 5 µs
Wall time: 7.39 µs
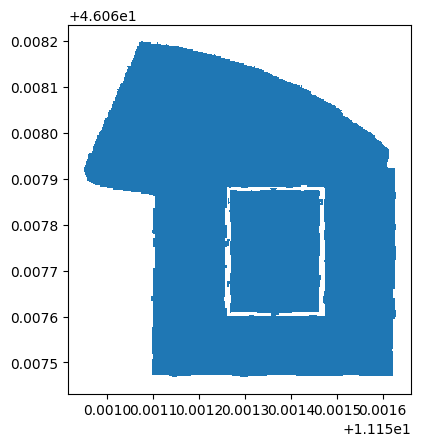
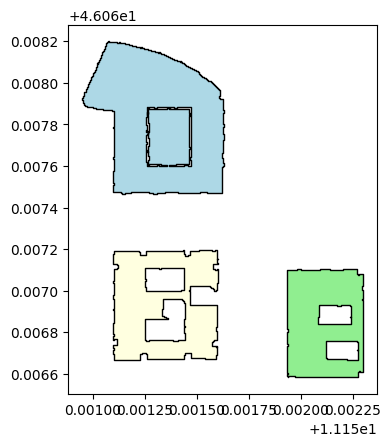
FBK Buildings
p_north = shapely.geometry.Point(11.15156,46.06782)
building_north = fbk_area_vector[fbk_area_vector.geometry.contains(p_north)]
building_north
| geometry | raster_val | |
|---|---|---|
| 42228 | POLYGON ((11.15107 46.06820, 11.15108 46.06820... | 181.0 |
building_north.plot()
plt.show()
p_west = shapely.geometry.Point(11.15116,46.06689)
building_west = fbk_area_vector[fbk_area_vector.geometry.contains(p_west)]
p_east = shapely.geometry.Point(11.15200,46.06684)
building_east = fbk_area_vector[fbk_area_vector.geometry.contains(p_east)]
building_east
| geometry | raster_val | |
|---|---|---|
| 70295 | POLYGON ((11.15198 46.06710, 11.15200 46.06710... | 193.0 |
fig, ax = plt.subplots()
building_north.plot(ax=ax, color='lightblue', edgecolor='black')
building_west.plot(ax=ax, color='lightyellow', edgecolor='black')
building_east.plot(ax=ax, color='lightgreen', edgecolor='black')
plt.show();
Identify what is possibile to see from the crossing point between Via Sommarive and Via dei Valoni
- identify the crossing point between Via Sommarive and Via dei Valoni
- calculate the viewshed by using the DTM
-
visualize it
for this operation we will use:
- xarray-spatial
xarray-spatial is a package for raster-based spatial analytics
among the supported functions there is the viewshed
The function returns A cell x in the visibility grid is recorded as follows: If it is invisible, then x is set to INVISIBLE. If it is visible, then x is set to the vertical angle w.r.t the viewpoint
- xarray-spatial
import xarray as xr
import numpy as np

from xrspatial import hillshade
from xrspatial import viewshed
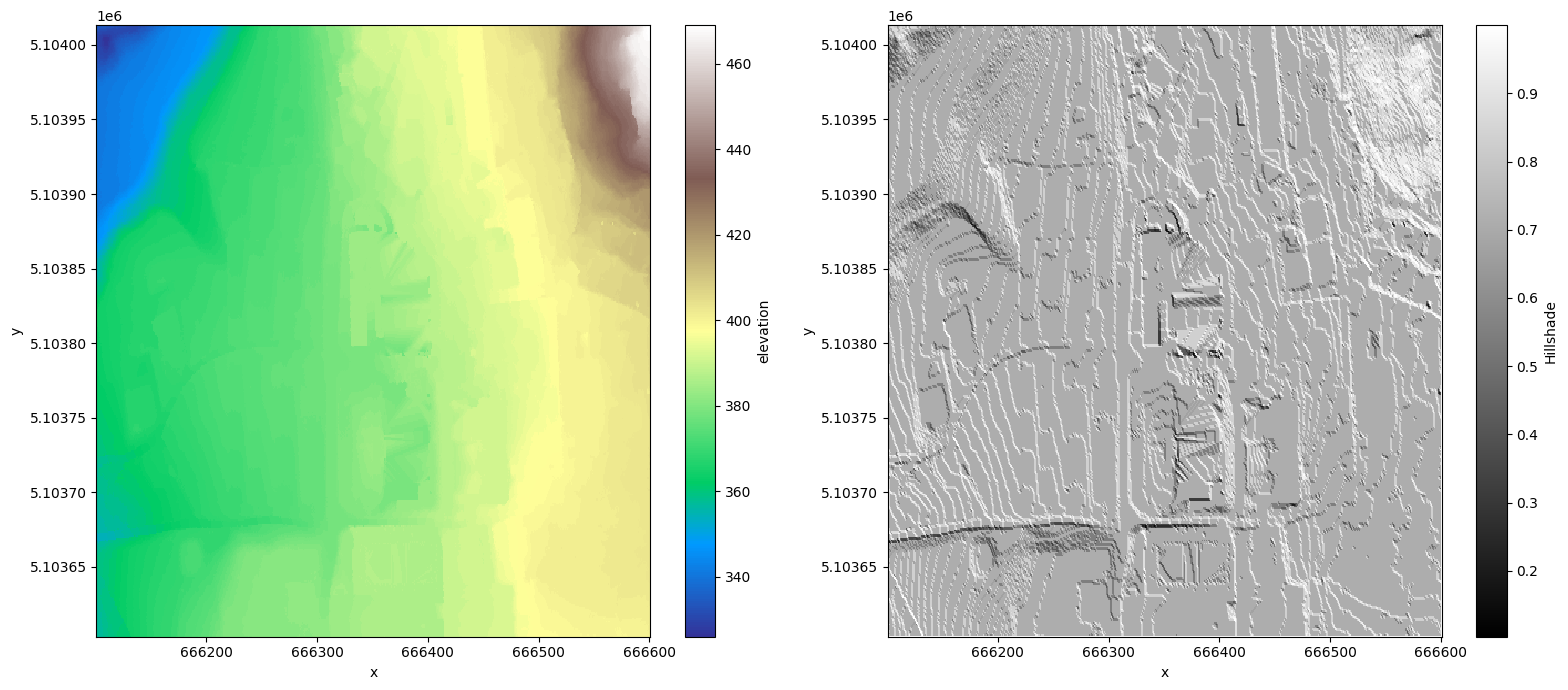
Visualize input data
We’ll compute hillshade of the raster to better understand it.
file_name = 'trento_scientifc_hub_povo_dtm.asc'
raster = xr.open_rasterio(file_name).sel(band=1).drop('band', dim=None)
raster.name = 'elevation'

xmin, xmax = raster.x.data.min(), raster.x.data.max()
ymin, ymax = raster.y.data.min(), raster.y.data.max()

xmin, xmax, ymin, ymax
(666101.1735466761, 666600.1735466761, 5103603.73583161, 5104012.73583161)
illuminated = hillshade(raster, name='Hillshade')
fig, (ax1, ax2) = plt.subplots(ncols=2, figsize=(16, 7))
raster.plot.imshow(ax=ax1, cmap='terrain')
illuminated.plot.imshow(ax=ax2, cmap='gray')
plt.tight_layout()
identify the crossing point between Via Sommarive and Via dei Valoni
we have already via Sommarive
via_sommarive
| id | @id | highway | lit | maxspeed | maxspeed:type | name | source:maxspeed | surface | geometry | |
|---|---|---|---|---|---|---|---|---|---|---|
| 0 | way/97004470 | way/97004470 | unclassified | yes | None | IT:urban | Via Sommarive | None | asphalt | LINESTRING (11.15039 46.06519, 11.15039 46.065... |
| 1 | way/382958545 | way/382958545 | residential | None | 50 | None | Via Sommarive | sign | asphalt | LINESTRING (11.15058 46.06828, 11.15045 46.068... |
… and we download Via dei Valóni - overpass-turbo
You can download the file here
via_valoni = gpd.read_file("https://github.com/napo/geospatial_course_unitn/raw/master/data/openstreetmap/via_valoni.geojson")
intersection = via_sommarive.intersection(via_valoni)
intersection= intersection.drop_duplicates()
intersection = intersection[intersection.geometry != None]
point_intersection = intersection.geometry[0]
lat=point_intersection.y
lon=point_intersection.x
calculate the viewshed by using the DTM
convert the point from WGS84 to ETRS89
import shapely
import pyproj
from shapely.ops import transform
wgs84 = pyproj.CRS('EPSG:4326')
crs_dtm = pyproj.CRS('EPSG:25832')
projection_transform = pyproj.Transformer.from_crs(wgs84, crs_dtm, always_xy=False).transform
def convert(x,y):
    p = shapely.geometry.Point(y,x)
    p = transform(projection_transform,p)
    return(p)
view_point = convert(lon,lat)
identify the cell contains the view point
gdf_view_point = gpd.GeoDataFrame(data={'name':['view_point'],'geometry':[view_point]},crs=raster.crs.split("=")[1])
df_points_dtm = raster.to_dataframe().reset_index()
raster.crs.split("=")[1].replace(":","=")
'epsg=25832'
gdf_points_dtm = gpd.GeoDataFrame(
    df_points_dtm['elevation'],geometry=gpd.points_from_xy(df_points_dtm.x,df_points_dtm.y),crs=raster.crs.split("=")[1])
nearest point on the raster to the view point
min_distance = round(min(gdf_points_dtm.geometry.distance(view_point)),3)
point_closest_view_point = gdf_points_dtm[round(gdf_points_dtm.geometry.distance(view_point),3) ==min_distance ]
elevation = point_closest_view_point.elevation.values[0]
elevation
378.0
x = point_closest_view_point.geometry.x.values[0]
y = point_closest_view_point.geometry.y.values[0]
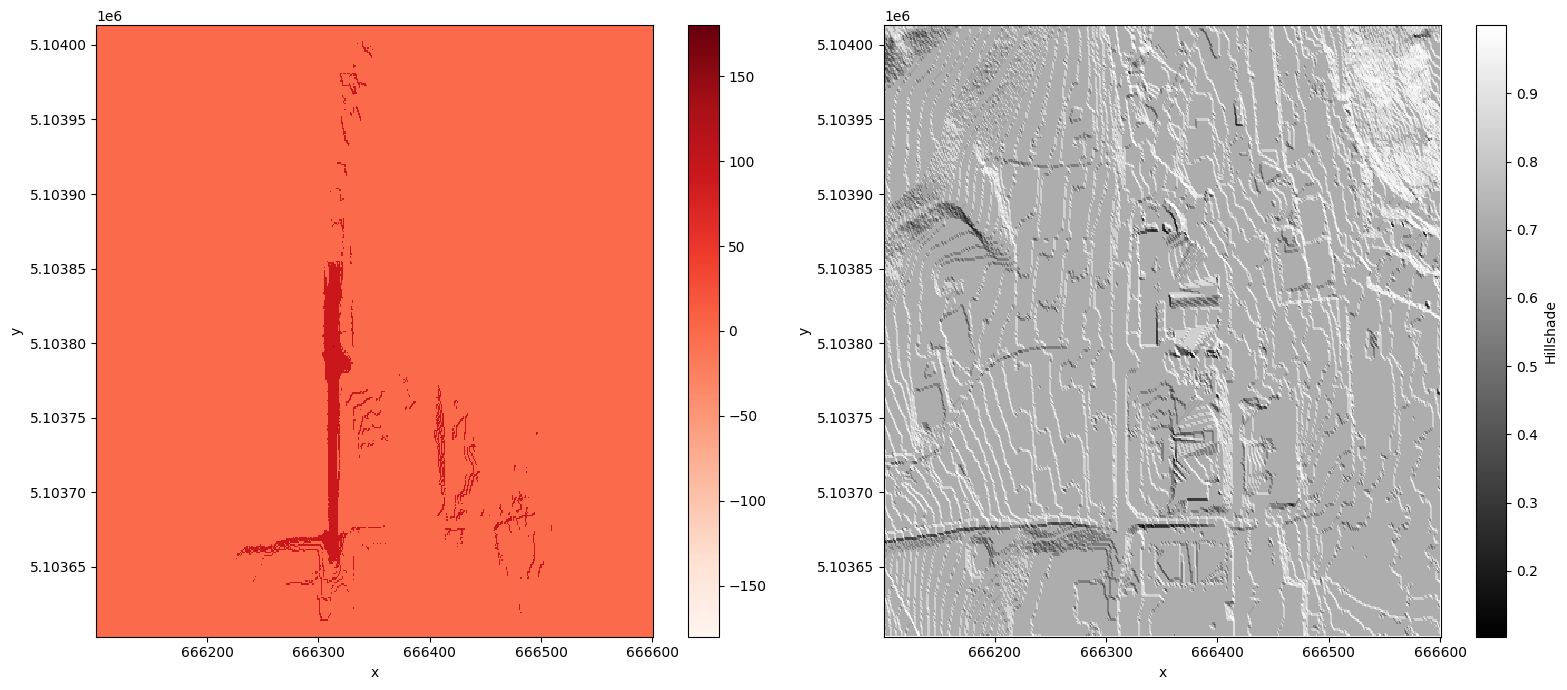
calculate the viewsheed
viewshed_grid = viewshed(raster, x=x, y=y)
raster_visibility = viewshed_grid.where(viewshed_grid == -1, other=1)
raster_visibility
<xarray.DataArray (y: 410, x: 500)>
array([[-1., -1., -1., ..., -1., -1., -1.],
       [-1., -1., -1., ..., -1., -1., -1.],
       [-1., -1., -1., ..., -1., -1., -1.],
       ...,
       [-1., -1., -1., ..., -1., -1., -1.],
       [-1., -1., -1., ..., -1., -1., -1.],
       [-1., -1., -1., ..., -1., -1., -1.]])
Coordinates:
  * y        (y) float64 5.104e+06 5.104e+06 5.104e+06 ... 5.104e+06 5.104e+06
  * x        (x) float64 6.661e+05 6.661e+05 6.661e+05 ... 6.666e+05 6.666e+05
Attributes:
    transform:   (1.0, 0.0, 666100.6735466761, 0.0, -1.0, 5104013.23583161)
    crs:         +init=epsg:25832
    res:         (1.0, 1.0)
    is_tiled:    0
    nodatavals:  (nan,)
    scales:      (1.0,)
offsets: (0.0,)visualize it
fig, (ax1, ax2) = plt.subplots(ncols=2, figsize=(16, 7))
viewshed_grid.plot.imshow(ax=ax1, cmap='Reds')
illuminated.plot.imshow(ax=ax2, cmap='gray')
plt.tight_layout()
df_raster_visibility = raster_visibility.to_dataframe("viewsheed_grid").reset_index()
df_raster_visibility = df_raster_visibility[df_raster_visibility['viewsheed_grid'] == 1]
df_raster_visibility.shape
(4508, 3)
gdf_raster_visibles = gpd.GeoDataFrame(
    df_raster_visibility['viewsheed_grid'],geometry=gpd.points_from_xy(df_raster_visibility.x,df_raster_visibility.y),crs=raster.crs.split("=")[1])
gdf_raster_visibles.unary_union.convex_hull

gdf_raster_visibles['geometry'] = gdf_raster_visibles.geometry.buffer(1).envelope
gdf_raster_visibles.dissolve().explore()
Make this Notebook Trusted to load map: File -> Trust Notebook